NOTES TO THE FINANCIAL STATEMENTS
30 JUNE 2016
NOTE 1. BASIS OF PREPARATION
These general purpose financial statements have been prepared in accordance with Australian Accounting Standards
and Interpretations issued by the Australian Accounting Standards Board (‘AASB’) and the Corporations Act 2001, as
appropriate for for-profit oriented entities. These financial statements also comply with International Financial Reporting
Standards as issued by the International Accounting Standards Board (‘IASB’).
Historical cost convention
The financial statements have been prepared under the historical cost convention, except for the revaluation of derivative
financial instruments at fair value.
Net current asset deficiency
As at 30 June 2016, Vocus’ current liabilities exceeded its current assets by $66,880,000. Vocus is satisfied that it will be
able to meet all its obligations as they fall due given its strong profitability and operating cash flows, existing cash reserves
and available finance facilities.
Critical accounting estimates
The preparation of the financial statements requires the use of certain critical accounting estimates. It also requires
management to exercise its judgement in the process of applying Vocus’ accounting policies. The areas involving a higher
degree of judgement or complexity, or areas where assumptions and estimates are significant to the financial statements,
are disclosed in note 2.
Parent entity information
In accordance with the Corporations Act 2001, these financial statements present the results of Vocus (as a Consolidated
entity) only. Supplementary information about the parent entity is disclosed in note 39.
NOTE 2. CRITICAL ACCOUNTING JUDGEMENTS, ESTIMATES AND ASSUMPTIONS
The preparation of the financial statements requires management to make judgements, estimates and assumptions that
affect the reported amounts in the financial statements. Management continually evaluates its judgements and estimates in
relation to assets, liabilities, contingent liabilities, revenue and expenses. Management bases its judgements, estimates and
assumptions on historical experience and on other various factors, including expectations of future events, management
believes to be reasonable under the circumstances. The resulting accounting judgements and estimates will seldom equal
the related actual results. The judgements, estimates and assumptions that have a significant risk of causing a material
adjustment to the carrying amounts of assets and liabilities (refer to the respective notes) within the next financial year are
discussed below.
Estimation of useful lives of assets
The estimated useful lives and related depreciation and amortisation charges for its property, plant and equipment and
finite life intangible assets is determined by the Company. The useful lives could change significantly as a result of technical
innovations or some other event. The depreciation and amortisation charge will increase where the useful lives are less than
previously estimated lives, or technically obsolete or non-strategic assets that have been abandoned or sold will be written
off or written down.
Goodwill and other indefinite life intangible assets
The recoverable amount of the Australia and New Zealand CGU’s have been determined based on a fair value less costs
of disposal calculation. In assessing fair value less costs of disposal, Vocus estimates post tax future cash flows including
expected synergistic benefits from recent mergers, further capital expenditure and a long term growth rate assumption, and
discounts these cash flows using a post-tax rate. These assumptions require managements’ judgement and are based on
market expectations.
50 | VOCUS.COM.AU
NOTE 2. CRITICAL ACCOUNTING JUDGEMENTS, ESTIMATES AND ASSUMPTIONS (continued)
Impairment of non-financial assets other than goodwill and other indefinite life intangible assets
Assessments of impairment of non-financial assets other than goodwill and other indefinite life intangible assets are made at
each reporting date by evaluating conditions specific to Vocus and to the particular asset that may lead to impairment. If an
impairment trigger exists, the recoverable amount of the asset is determined. This involves fair value less costs of disposal or
value-in-use calculations, which incorporate a number of key estimates and assumptions.
Derivative financial instruments
Forward foreign exchange contracts, designated as cash flow hedges, are measured at fair value. Reliance is placed on
future cash flows and judgement is made on a regular basis, through prospective and retrospective testing, including at the
reporting date, that the hedges are still highly effective.
Business combinations
As discussed in note 40, business combinations are initially accounted for on a provisional basis. The fair value of
assets acquired, liabilities and contingent liabilities assumed are initially estimated taking into consideration all available
information at the reporting date. Fair value adjustments on the finalisation of the business combination accounting is
retrospective, where applicable, to the period the combination occurred and may have an impact on the assets and
liabilities, depreciation and amortisation reported.
Unbilled revenue
Unbilled revenue for gas and electricity is estimated at the end of the reporting period. Customers are billed on a periodic
and regular basis. Management estimates customer consumption between the last invoice date and the end of the reporting
period. This is based on preliminary usage obtained from external regulators at an estimated bill rate. Various assumptions
and financial models are used to determine the estimated unbilled rate.
NOTE 3. OPERATING SEGMENTS
Reporting segments
Segment information is based on the information that management uses to make decisions about operating matters and
allows users to review operations through the eyes of management.
Operating segments represent the information reported to the chief operating decision makers (CODM), being the
executive management team, for the purposes of resource allocation and assessment of segment performance focuses on
the jurisdiction in which the services are delivered or provided.
Consistent with information presented for internal management reporting purposes, the result of each segment is measured
based on its EBITDA contribution. Corporate costs are allocated to segments (and included within segment EBITDA) with
reference to the resources allocated to provide those services to each segment.
The directors of Vocus have chosen to organise the Group around the two main jurisdictions in which the Group operates.
Specifically, the Group’s reportable segments under AASB 8 are as follows:
➜➜ Australia
➜➜ New Zealand
The reportable segments also represent the group’s cash-generating units for impairment testing purposes.
In the prior year, Vocus operated and disclosed as a single operating segment. The prior year reporting segment
information has been restated below in line with current year segments.
51
NOTES TO THE FINANCIAL STATEMENTS CONTINUED
30 JUNE 2016
NOTE 3. OPERATING SEGMENTS (continued)
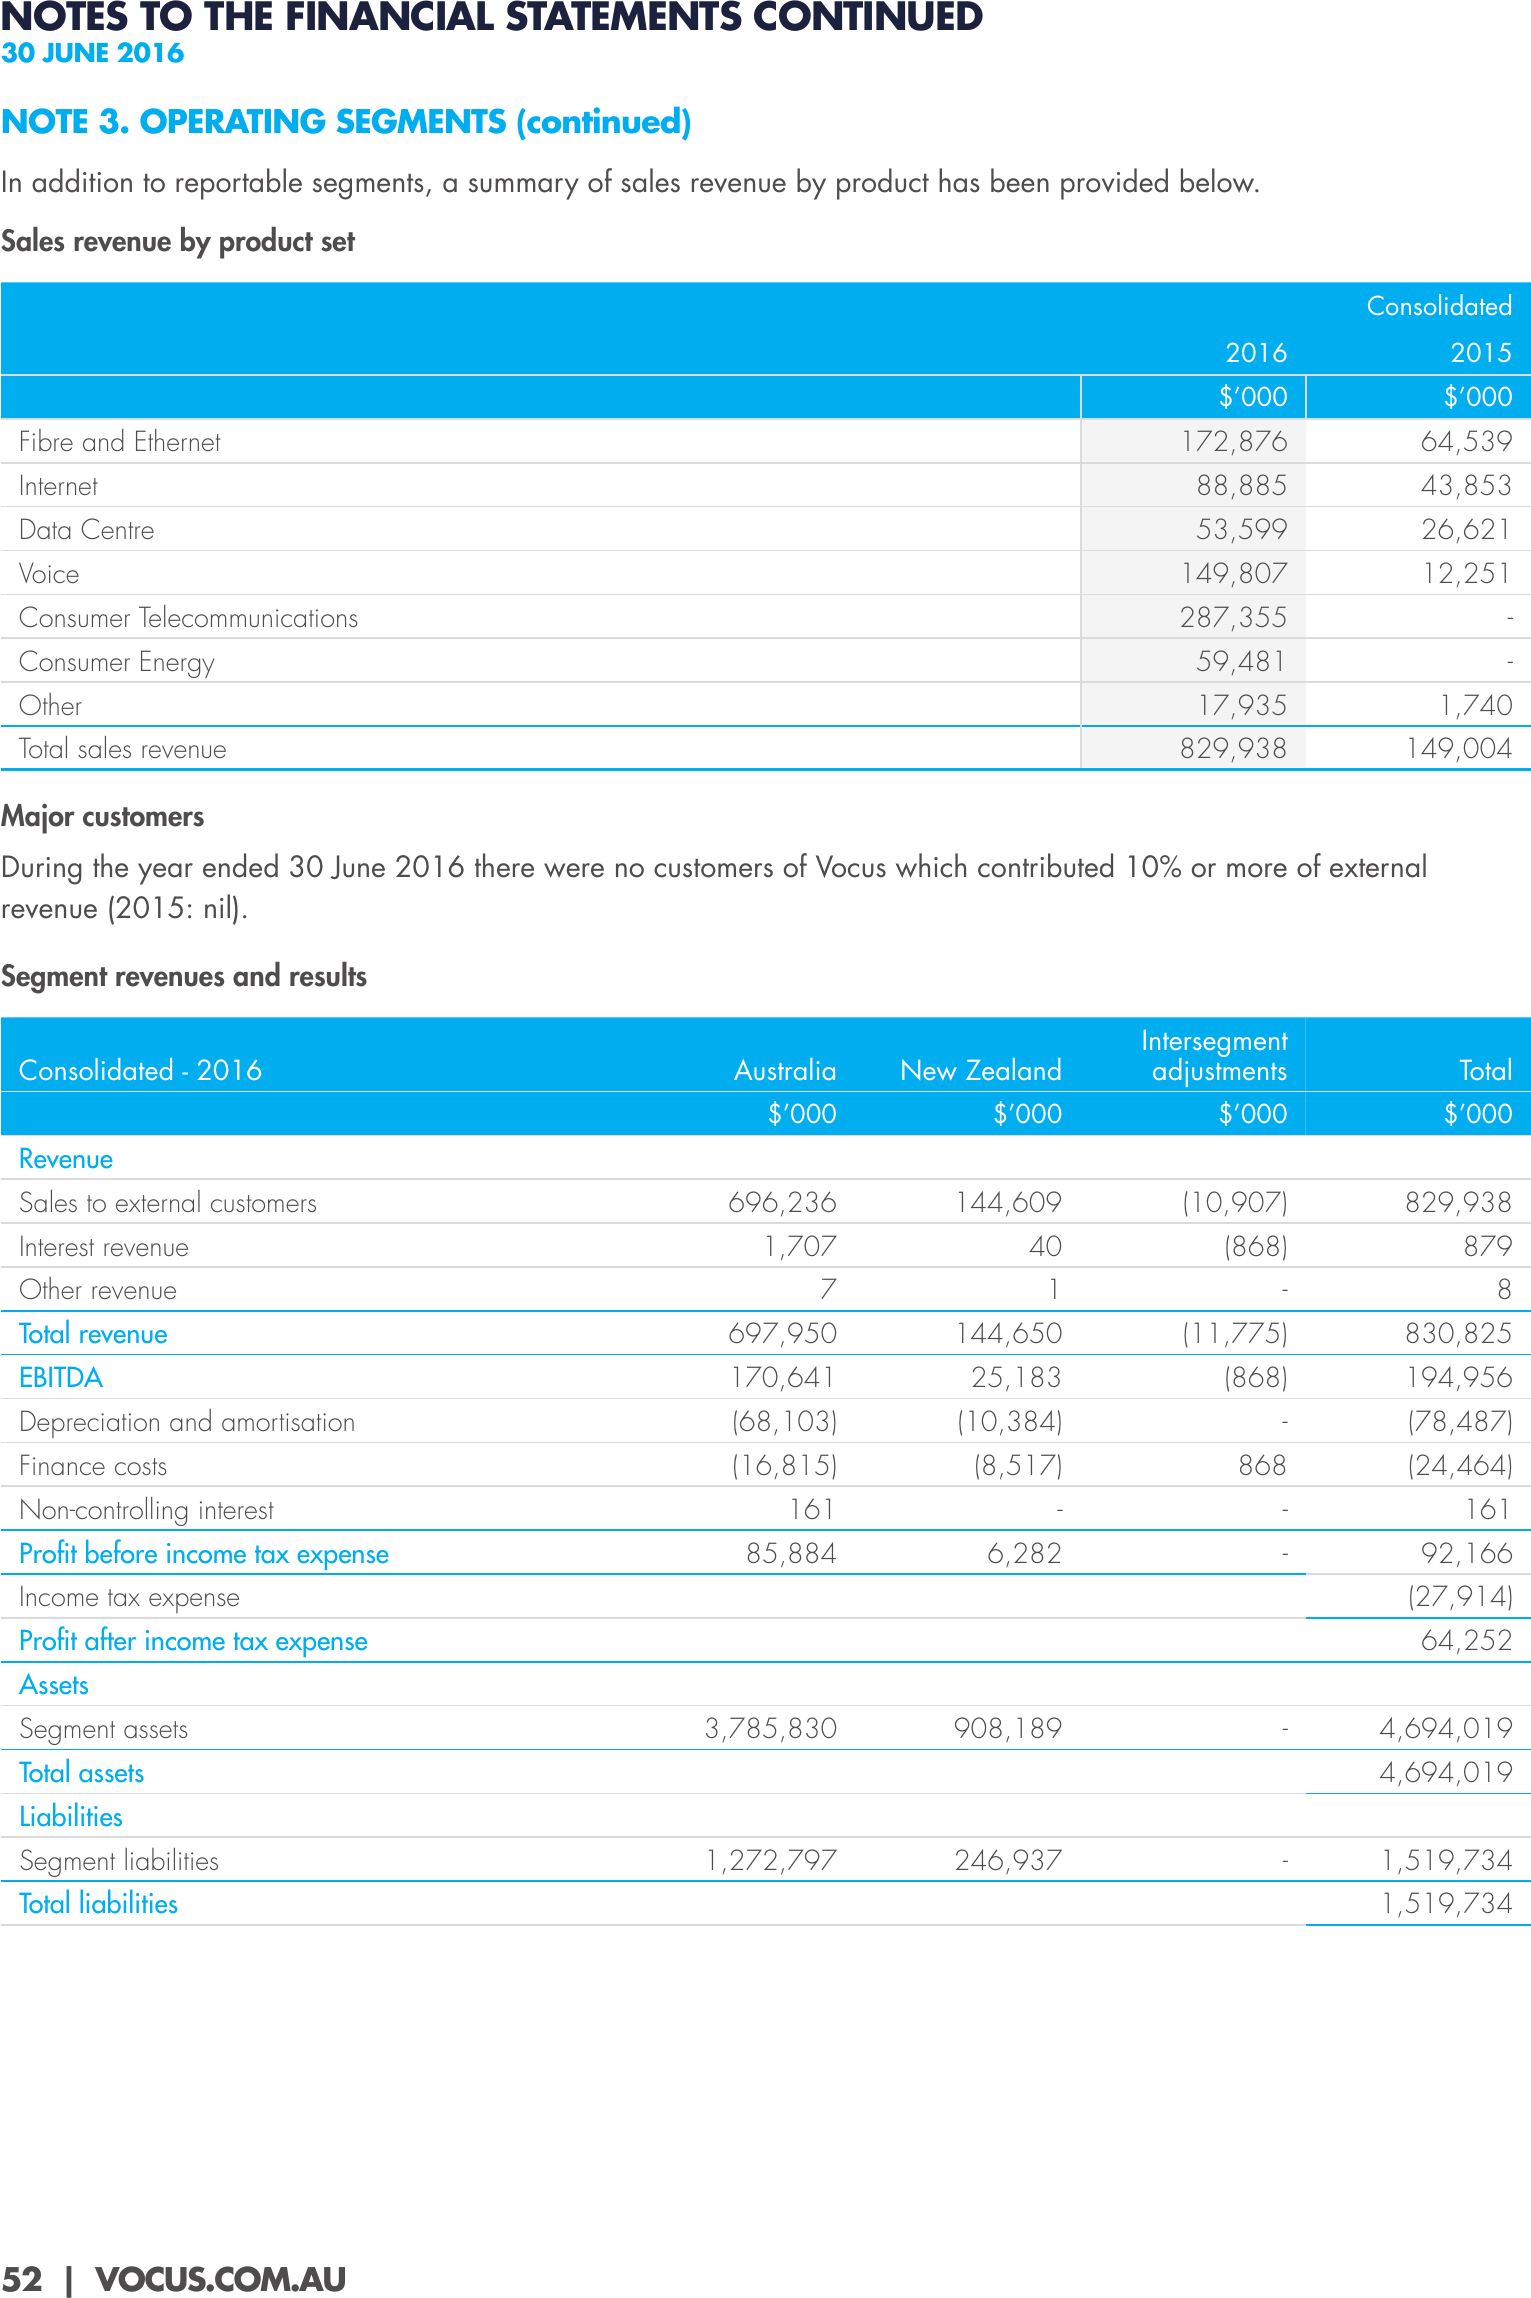
In addition to reportable segments, a summary of sales revenue by product has been provided below.
Sales revenue by product set
Consolidated
2016
2015
$’000
$’000
172,876
64,539
Internet
88,885
43,853
Data Centre
53,599
26,621
Voice
149,807
12,251
Consumer Telecommunications
287,355
-
Fibre and Ethernet
Consumer Energy
59,481
-
Other
17,935
1,740
829,938
149,004
Total sales revenue
Major customers
During the year ended 30 June 2016 there were no customers of Vocus which contributed 10% or more of external
revenue (2015: nil).
Segment revenues and results
Australia
New Zealand
Intersegment
adjustments
Total
$’000
$’000
$’000
$’000
696,236
144,609
(10,907)
829,938
1,707
40
(868)
879
7
1
-
8
Total revenue
697,950
144,650
(11,775)
830,825
EBITDA
170,641
25,183
(868)
194,956
Depreciation and amortisation
(68,103)
(10,384)
-
(78,487)
Finance costs
(16,815)
(8,517)
868
(24,464)
161
-
-
161
85,884
6,282
-
Consolidated - 2016
Revenue
Sales to external customers
Interest revenue
Other revenue
Non-controlling interest
Profit before income tax expense
Income tax expense
92,166
(27,914)
Profit after income tax expense
64,252
Assets
Segment assets
3,785,830
908,189
-
Total assets
4,694,019
4,694,019
Liabilities
Segment liabilities
Total liabilities
52 | VOCUS.COM.AU
1,272,797
246,937
-
1,519,734
1,519,734
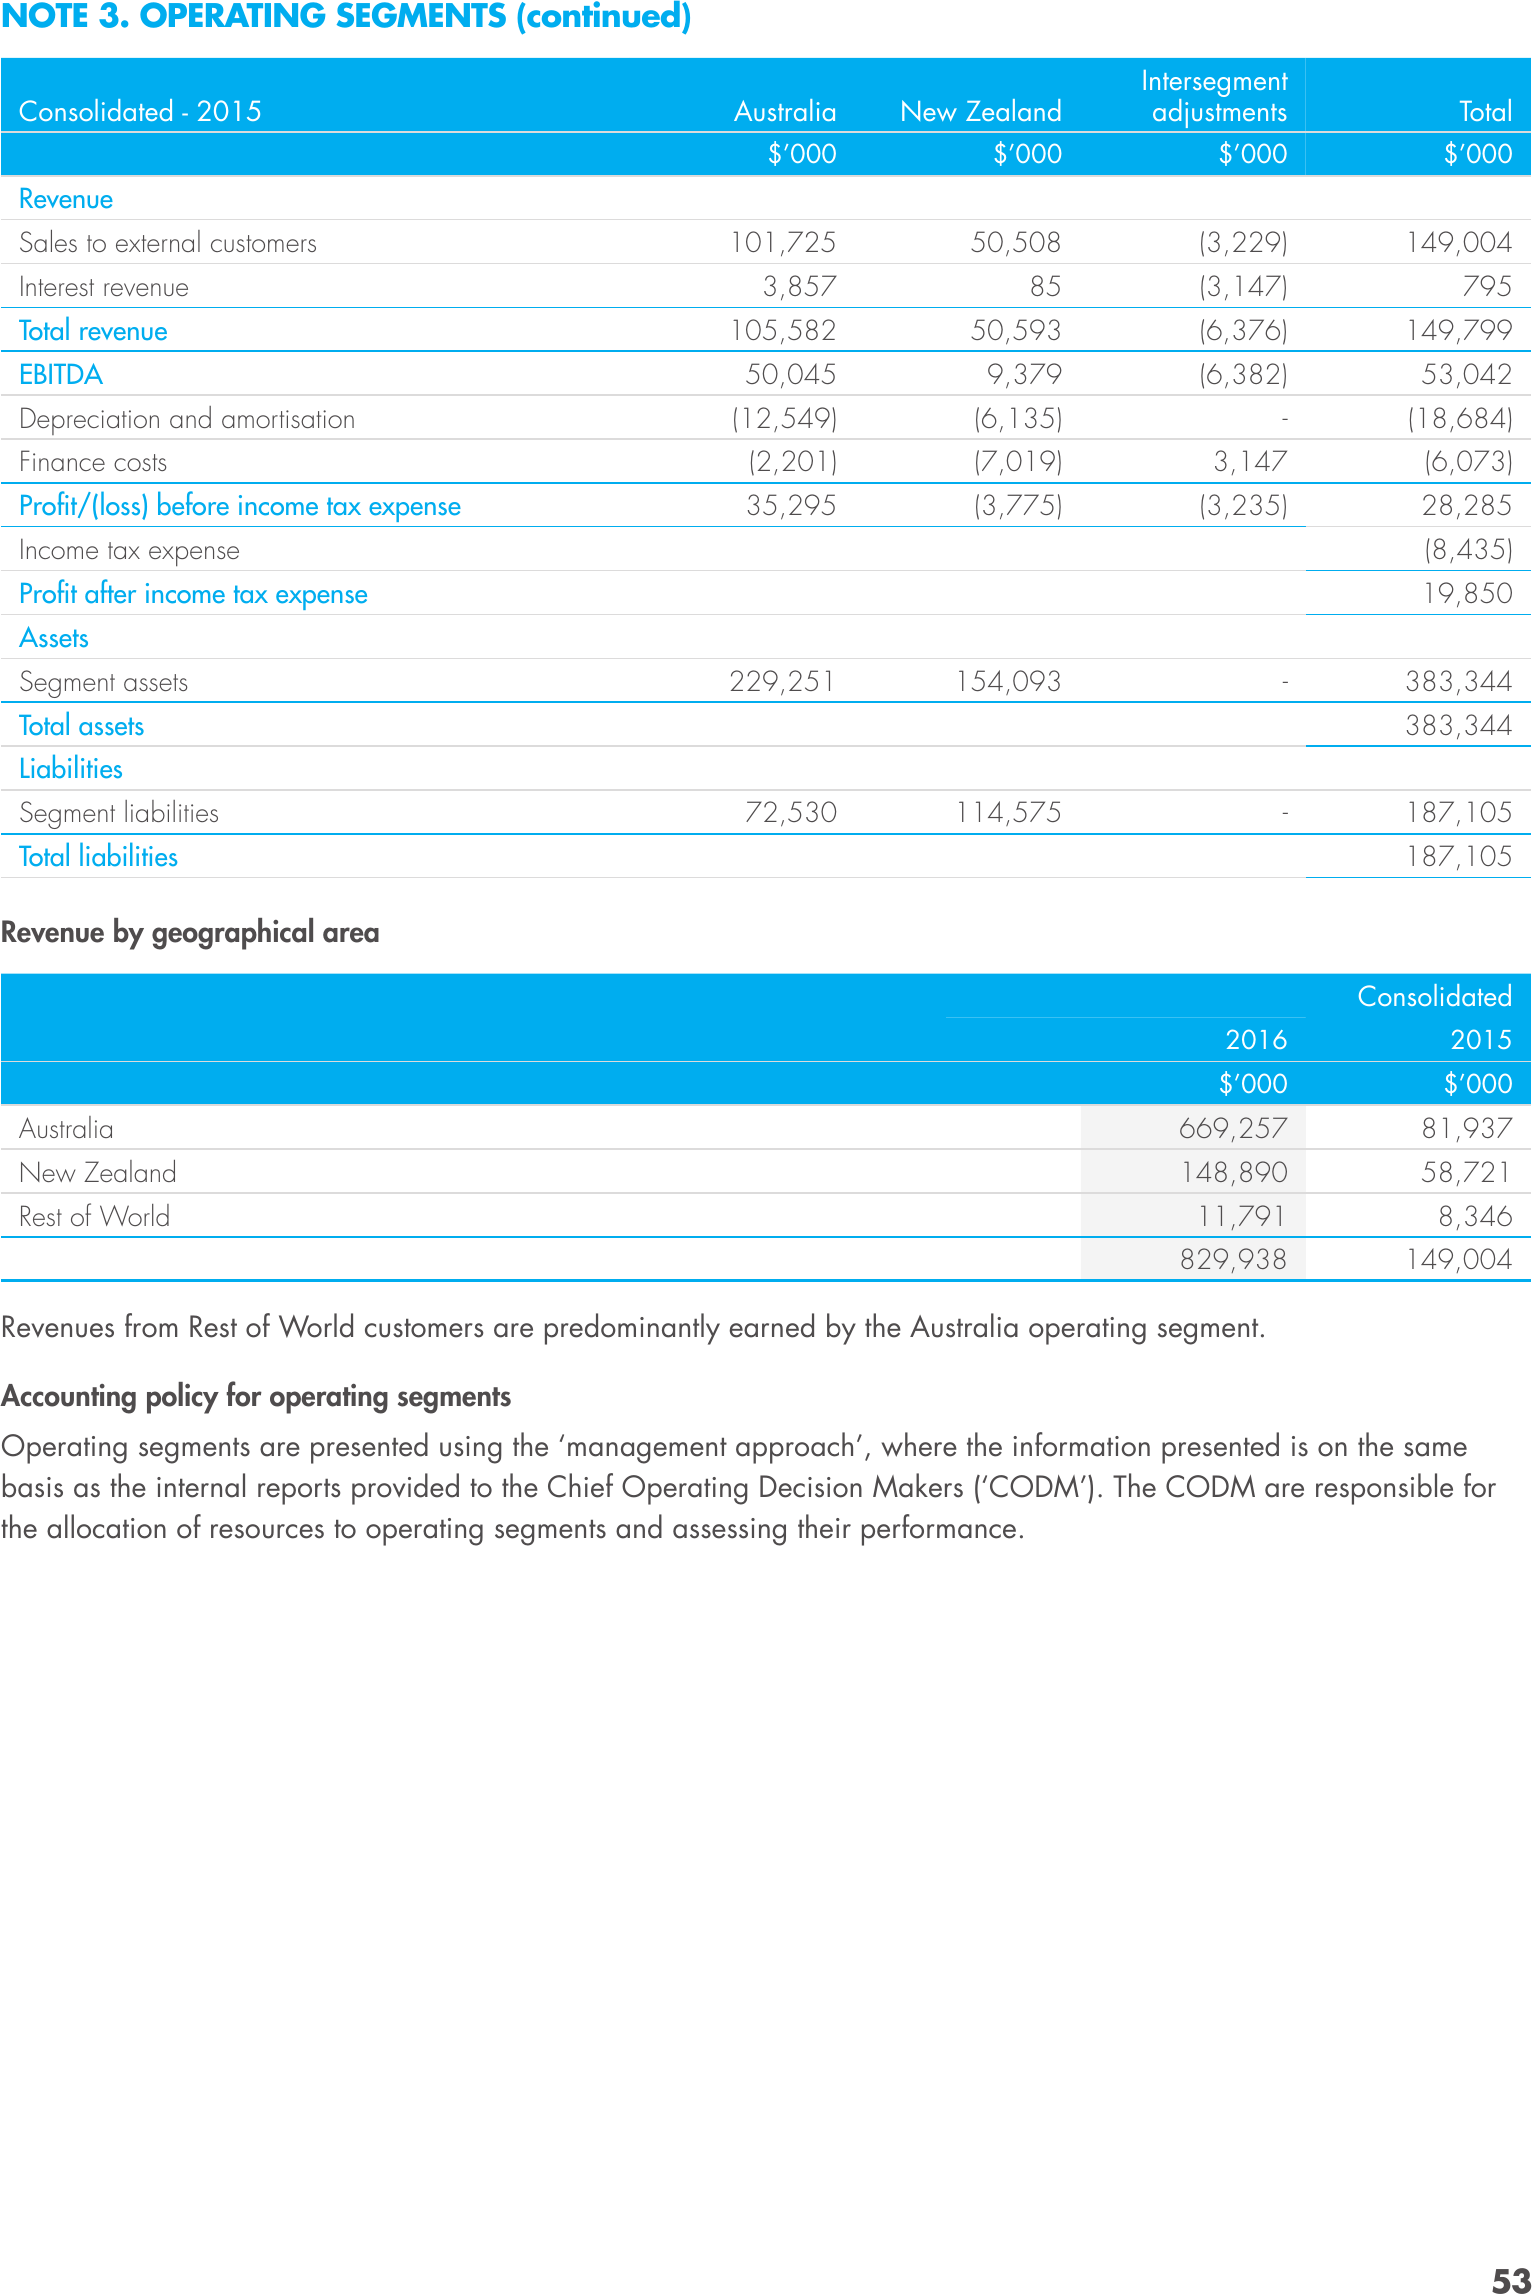
NOTE 3. OPERATING SEGMENTS (continued)
Australia
New Zealand
Intersegment
adjustments
Total
$’000
Consolidated - 2015
$’000
$’000
$’000
101,725
50,508
(3,229)
149,004
3,857
85
(3,147)
795
105,582
50,593
(6,376)
149,799
Revenue
Sales to external customers
Interest revenue
Total revenue
EBITDA
50,045
9,379
(6,382)
53,042
(12,549)
(6,135)
-
(18,684)
Finance costs
(2,201)
(7,019)
3,147
(6,073)
Profit/(loss) before income tax expense
35,295
(3,775)
(3,235)
28,285
Depreciation and amortisation
Income tax expense
(8,435)
Profit after income tax expense
19,850
Assets
Segment assets
229,251
154,093
-
Total assets
383,344
383,344
Liabilities
Segment liabilities
72,530
114,575
-
Total liabilities
187,105
187,105
Revenue by geographical area
Consolidated
2016
2015
$’000
$’000
Australia
669,257
81,937
New Zealand
148,890
58,721
Rest of World
11,791
8,346
829,938
149,004
Revenues from Rest of World customers are predominantly earned by the Australia operating segment.
Accounting policy for operating segments
Operating segments are presented using the ‘management approach’, where the information presented is on the same
basis as the internal reports provided to the Chief Operating Decision Makers (‘CODM’). The CODM are responsible for
the allocation of resources to operating segments and assessing their performance.
53
NOTES TO THE FINANCIAL STATEMENTS CONTINUED
30 JUNE 2016
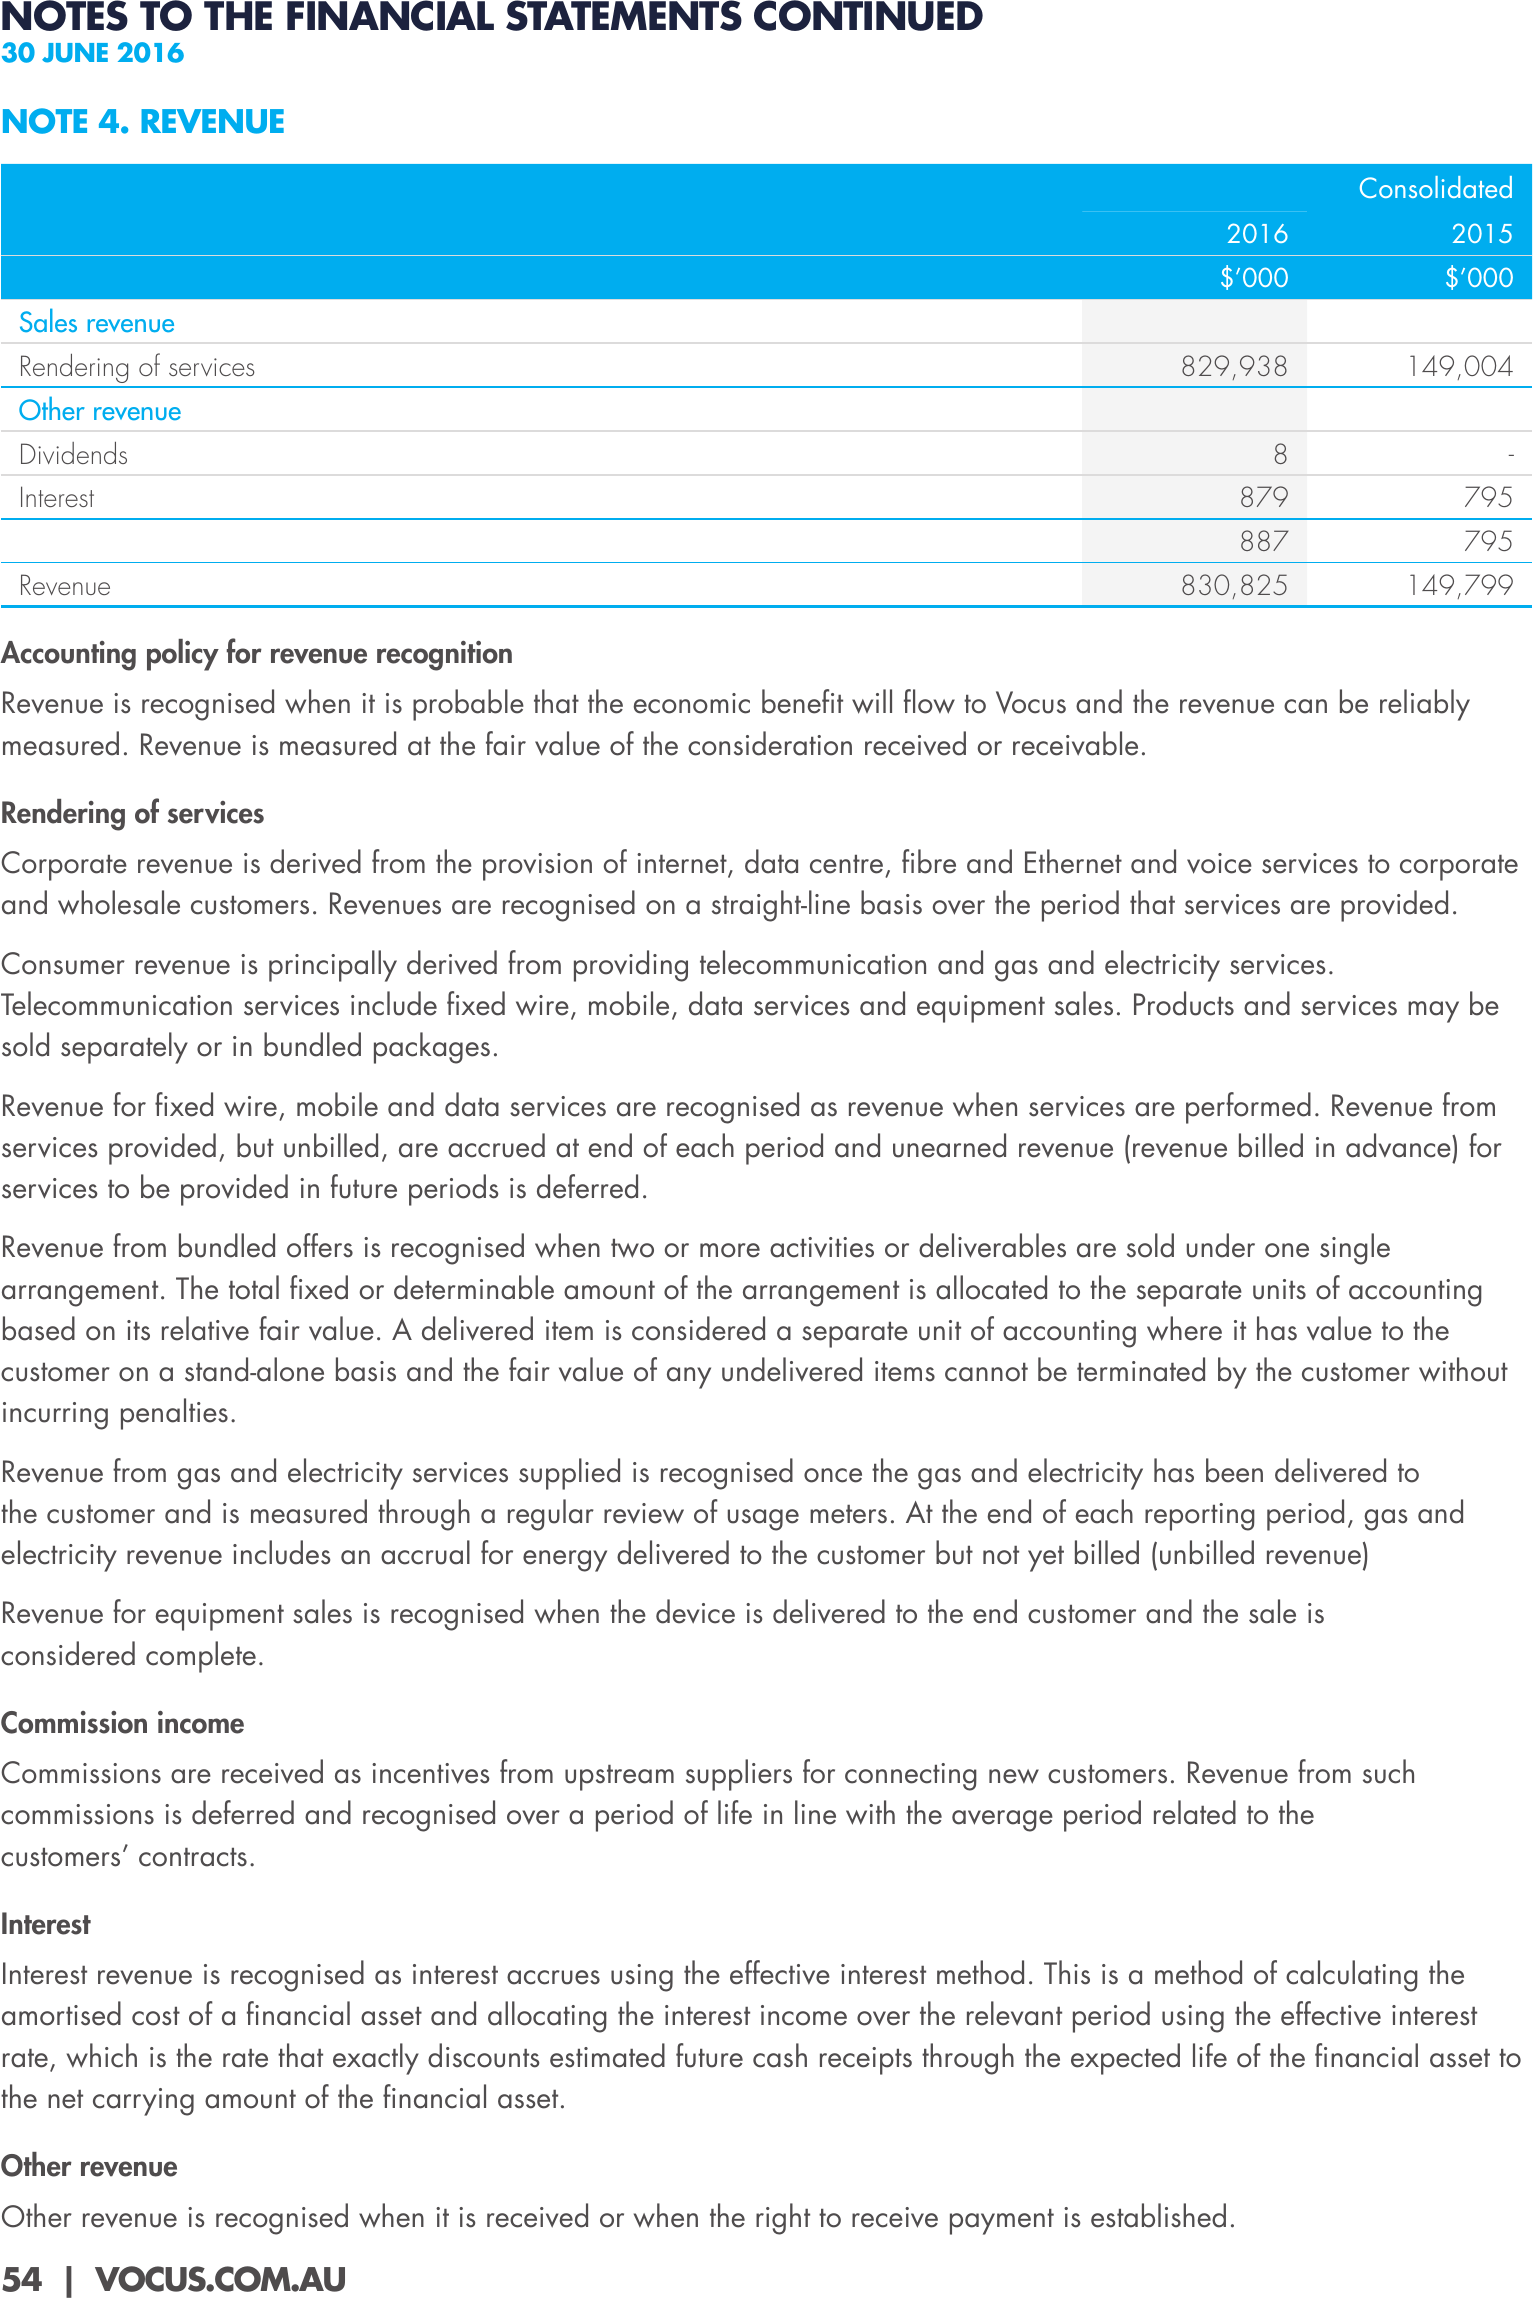
NOTE 4. REVENUE
Consolidated
2016
2015
$’000
$’000
829,938
149,004
8
-
Sales revenue
Rendering of services
Other revenue
Dividends
Interest
Revenue
879
795
887
795
830,825
149,799
Accounting policy for revenue recognition
Revenue is recognised when it is probable that the economic benefit will flow to Vocus and the revenue can be reliably
measured. Revenue is measured at the fair value of the consideration received or receivable.
Rendering of services
Corporate revenue is derived from the provision of internet, data centre, fibre and Ethernet and voice services to corporate
and wholesale customers. Revenues are recognised on a straight-line basis over the period that services are provided.
Consumer revenue is principally derived from providing telecommunication and gas and electricity services.
Telecommunication services include fixed wire, mobile, data services and equipment sales. Products and services may be
sold separately or in bundled packages.
Revenue for fixed wire, mobile and data services are recognised as revenue when services are performed. Revenue from
services provided, but unbilled, are accrued at end of each period and unearned revenue (revenue billed in advance) for
services to be provided in future periods is deferred.
Revenue from bundled offers is recognised when two or more activities or deliverables are sold under one single
arrangement. The total fixed or determinable amount of the arrangement is allocated to the separate units of accounting
based on its relative fair value. A delivered item is considered a separate unit of accounting where it has value to the
customer on a stand-alone basis and the fair value of any undelivered items cannot be terminated by the customer without
incurring penalties.
Revenue from gas and electricity services supplied is recognised once the gas and electricity has been delivered to
the customer and is measured through a regular review of usage meters. At the end of each reporting period, gas and
electricity revenue includes an accrual for energy delivered to the customer but not yet billed (unbilled revenue)
Revenue for equipment sales is recognised when the device is delivered to the end customer and the sale is
considered complete.
Commission income
Commissions are received as incentives from upstream suppliers for connecting new customers. Revenue from such
commissions is deferred and recognised over a period of life in line with the average period related to the
customers’ contracts.
Interest
Interest revenue is recognised as interest accrues using the effective interest method. This is a method of calculating the
amortised cost of a financial asset and allocating the interest income over the relevant period using the effective interest
rate, which is the rate that exactly discounts estimated future cash receipts through the expected life of the financial asset to
the net carrying amount of the financial asset.
Other revenue
Other revenue is recognised when it is received or when the right to receive payment is established.
54 | VOCUS.COM.AU
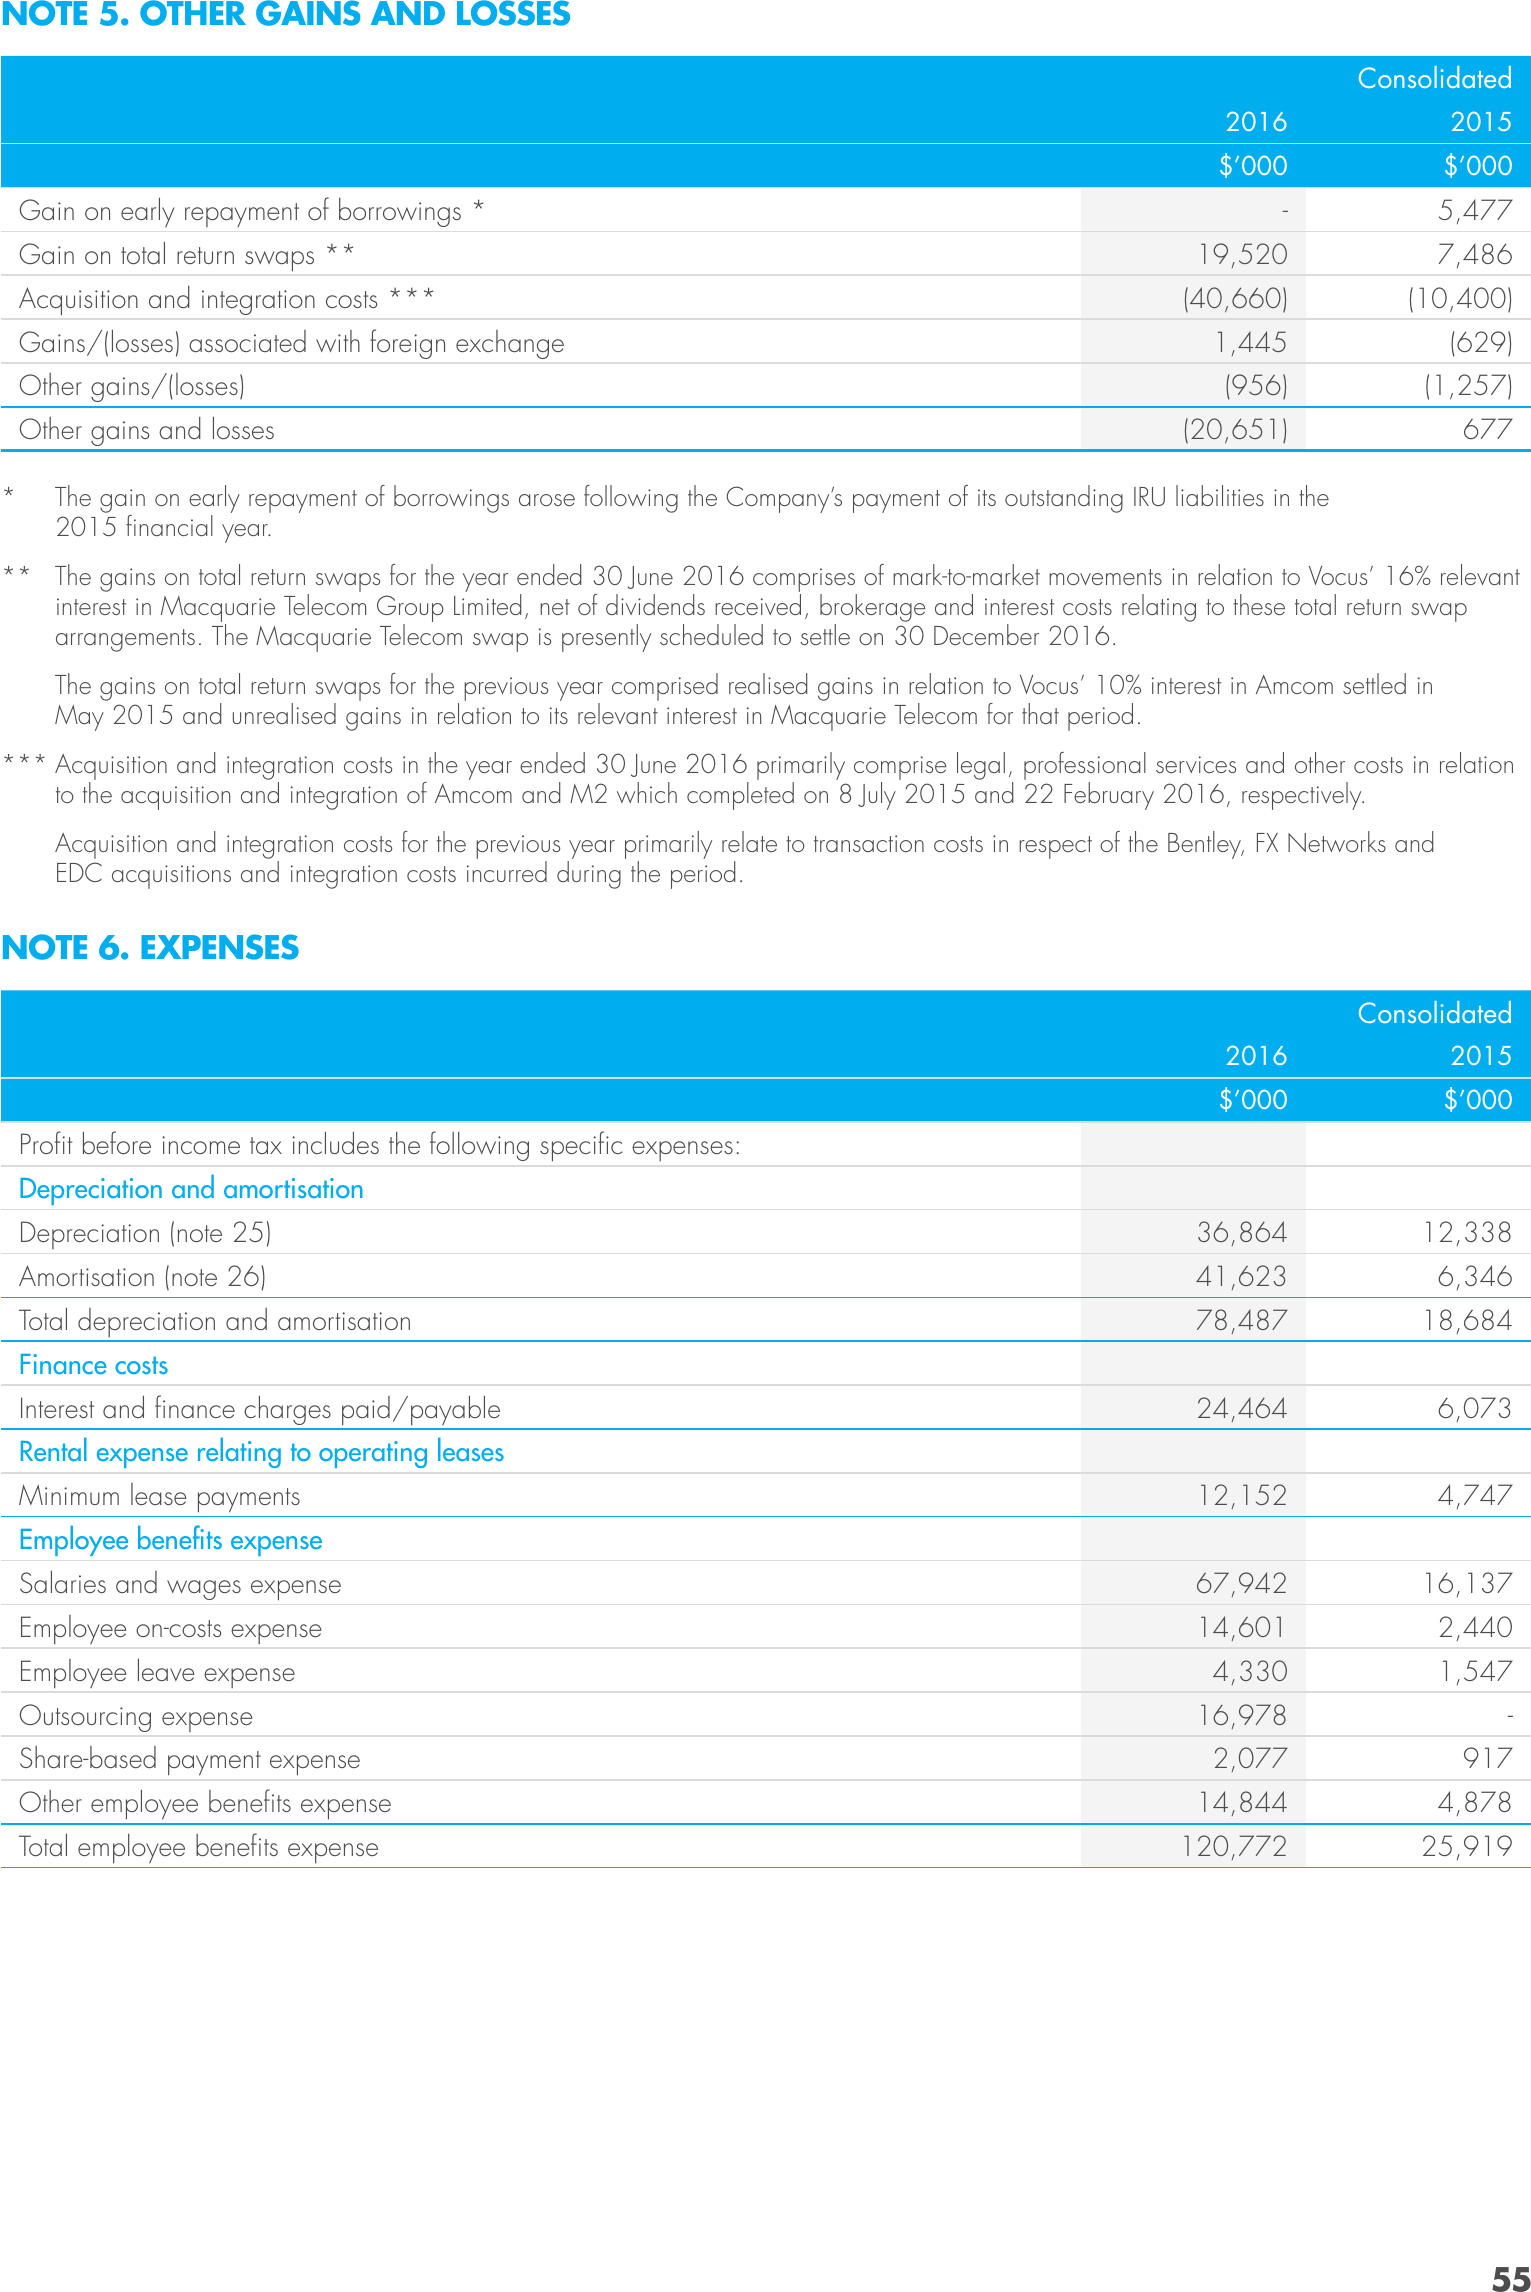
NOTE 5. OTHER GAINS AND LOSSES
Consolidated
2016
2015
$’000
Gain on early repayment of borrowings *
Gain on total return swaps **
Acquisition and integration costs ***
Gains/(losses) associated with foreign exchange
Other gains/(losses)
Other gains and losses
$’000
-
5,477
19,520
7,486
(40,660)
(10,400)
1,445
(629)
(956)
(1,257)
(20,651)
677
* The gain on early repayment of borrowings arose following the Company’s payment of its outstanding IRU liabilities in the
2015 financial year.
** The gains on total return swaps for the year ended 30 June 2016 comprises of mark-to-market movements in relation to Vocus’ 16% relevant
interest in Macquarie Telecom Group Limited, net of dividends received, brokerage and interest costs relating to these total return swap
arrangements. The Macquarie Telecom swap is presently scheduled to settle on 30 December 2016.
The gains on total return swaps for the previous year comprised realised gains in relation to Vocus’ 10% interest in Amcom settled in
May 2015 and unrealised gains in relation to its relevant interest in Macquarie Telecom for that period.
*** Acquisition and integration costs in the year ended 30 June 2016 primarily comprise legal, professional services and other costs in relation
to the acquisition and integration of Amcom and M2 which completed on 8 July 2015 and 22 February 2016, respectively.
Acquisition and integration costs for the previous year primarily relate to transaction costs in respect of the Bentley, FX Networks and
EDC acquisitions and integration costs incurred during the period.
NOTE 6. EXPENSES
Consolidated
2016
2015
$’000
$’000
Depreciation (note 25)
36,864
12,338
Amortisation (note 26)
41,623
6,346
Total depreciation and amortisation
78,487
18,684
24,464
6,073
12,152
4,747
Salaries and wages expense
67,942
16,137
Employee on-costs expense
14,601
2,440
4,330
1,547
Profit before income tax includes the following specific expenses:
Depreciation and amortisation
Finance costs
Interest and finance charges paid/payable
Rental expense relating to operating leases
Minimum lease payments
Employee benefits expense
Employee leave expense
Outsourcing expense
Share-based payment expense
Other employee benefits expense
Total employee benefits expense
16,978
-
2,077
917
14,844
4,878
120,772
25,919
55
NOTES TO THE FINANCIAL STATEMENTS CONTINUED
30 JUNE 2016
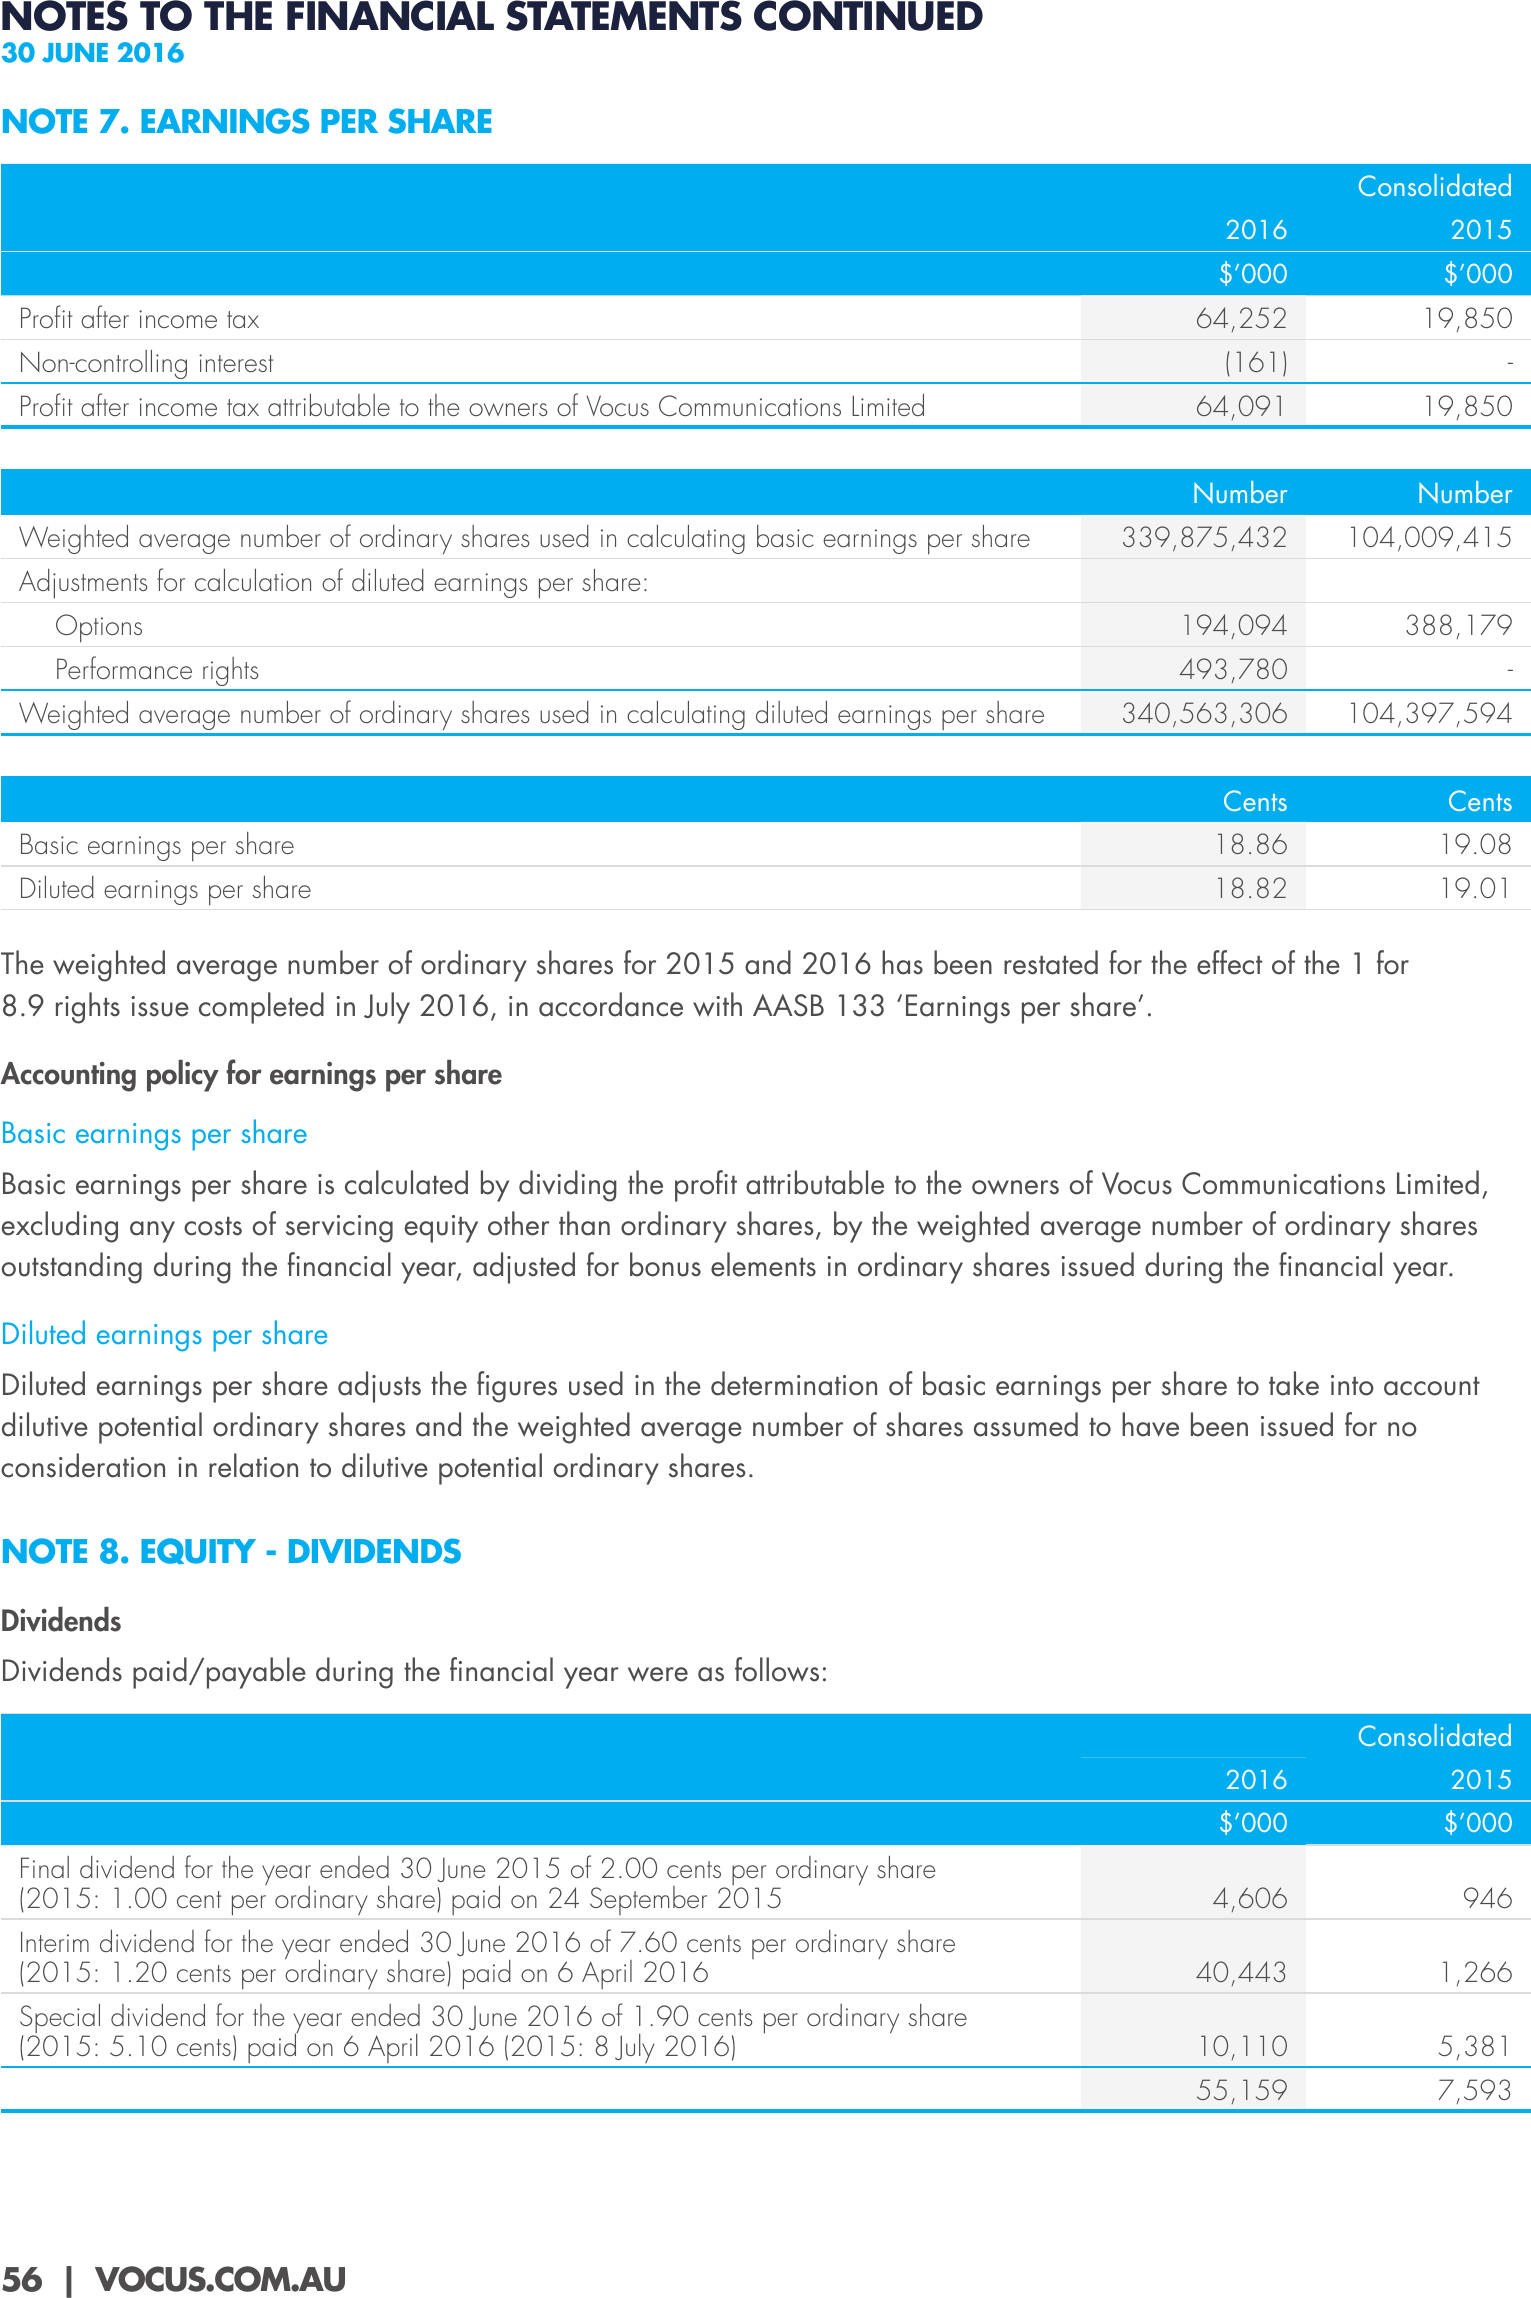
NOTE 7. EARNINGS PER SHARE
Consolidated
2016
Profit after income tax
Non-controlling interest
Profit after income tax attributable to the owners of Vocus Communications Limited
2015
$’000
$’000
64,252
19,850
(161)
-
64,091
19,850
Number
Number
339,875,432
104,009,415
Options
194,094
388,179
Performance rights
493,780
-
340,563,306
104,397,594
Weighted average number of ordinary shares used in calculating basic earnings per share
Adjustments for calculation of diluted earnings per share:
Weighted average number of ordinary shares used in calculating diluted earnings per share
Cents
Cents
Basic earnings per share
18.86
19.08
Diluted earnings per share
18.82
19.01
The weighted average number of ordinary shares for 2015 and 2016 has been restated for the effect of the 1 for
8.9 rights issue completed in July 2016, in accordance with AASB 133 ‘Earnings per share’.
Accounting policy for earnings per share
Basic earnings per share
Basic earnings per share is calculated by dividing the profit attributable to the owners of Vocus Communications Limited,
excluding any costs of servicing equity other than ordinary shares, by the weighted average number of ordinary shares
outstanding during the financial year, adjusted for bonus elements in ordinary shares issued during the financial year.
Diluted earnings per share
Diluted earnings per share adjusts the figures used in the determination of basic earnings per share to take into account
dilutive potential ordinary shares and the weighted average number of shares assumed to have been issued for no
consideration in relation to dilutive potential ordinary shares.
NOTE 8. EQUITY - DIVIDENDS
Dividends
Dividends paid/payable during the financial year were as follows:
Consolidated
2016
2015
$’000
$’000
4,606
946
Interim dividend for the year ended 30 June 2016 of 7.60 cents per ordinary share
(2015: 1.20 cents per ordinary share) paid on 6 April 2016
40,443
1,266
Special dividend for the year ended 30 June 2016 of 1.90 cents per ordinary share
(2015: 5.10 cents) paid on 6 April 2016 (2015: 8 July 2016)
10,110
5,381
55,159
7,593
Final dividend for the year ended 30 June 2015 of 2.00 cents per ordinary share
(2015: 1.00 cent per ordinary share) paid on 24 September 2015
56 | VOCUS.COM.AU
NOTE 8. EQUITY - DIVIDENDS (continued)
On 23 August 2016, the Directors declared a final fully franked dividend of 8.0 cents per share on ordinary shares
in respect of its financial year ended 30 June 2016. This dividend is to be paid on 4 October 2016, for shareholders
registered on 20 September 2016. The dividend is eligible for the Vocus Dividend Reinvestment Plan.
The directors have adopted a dividend policy to deliver growing dividends, reflective of profitability, cash position and
investment opportunities.
The Vocus Dividend Reinvestment Plan (DRP) allows shareholders to elect to receive their dividends in the form of Vocus
shares, offered at a discount of 1.5% to the volume weighted average price, in aggregate, over the five trading days
commencing on and including the next trading day after the dividend record date.
In relation to the final dividend for the year ended 30 June 2016, the issue price will be the volume weighted average
price for the period 21 September 2016 to 27 September 2016, less the discount of 1.5%. The last date for receipt of
election notices for participation in the DRP in relation to this dividend is 21 September 2016.
1,203,192 shares were issued in respect of the DRP in the financial year ended 30 June 2016.
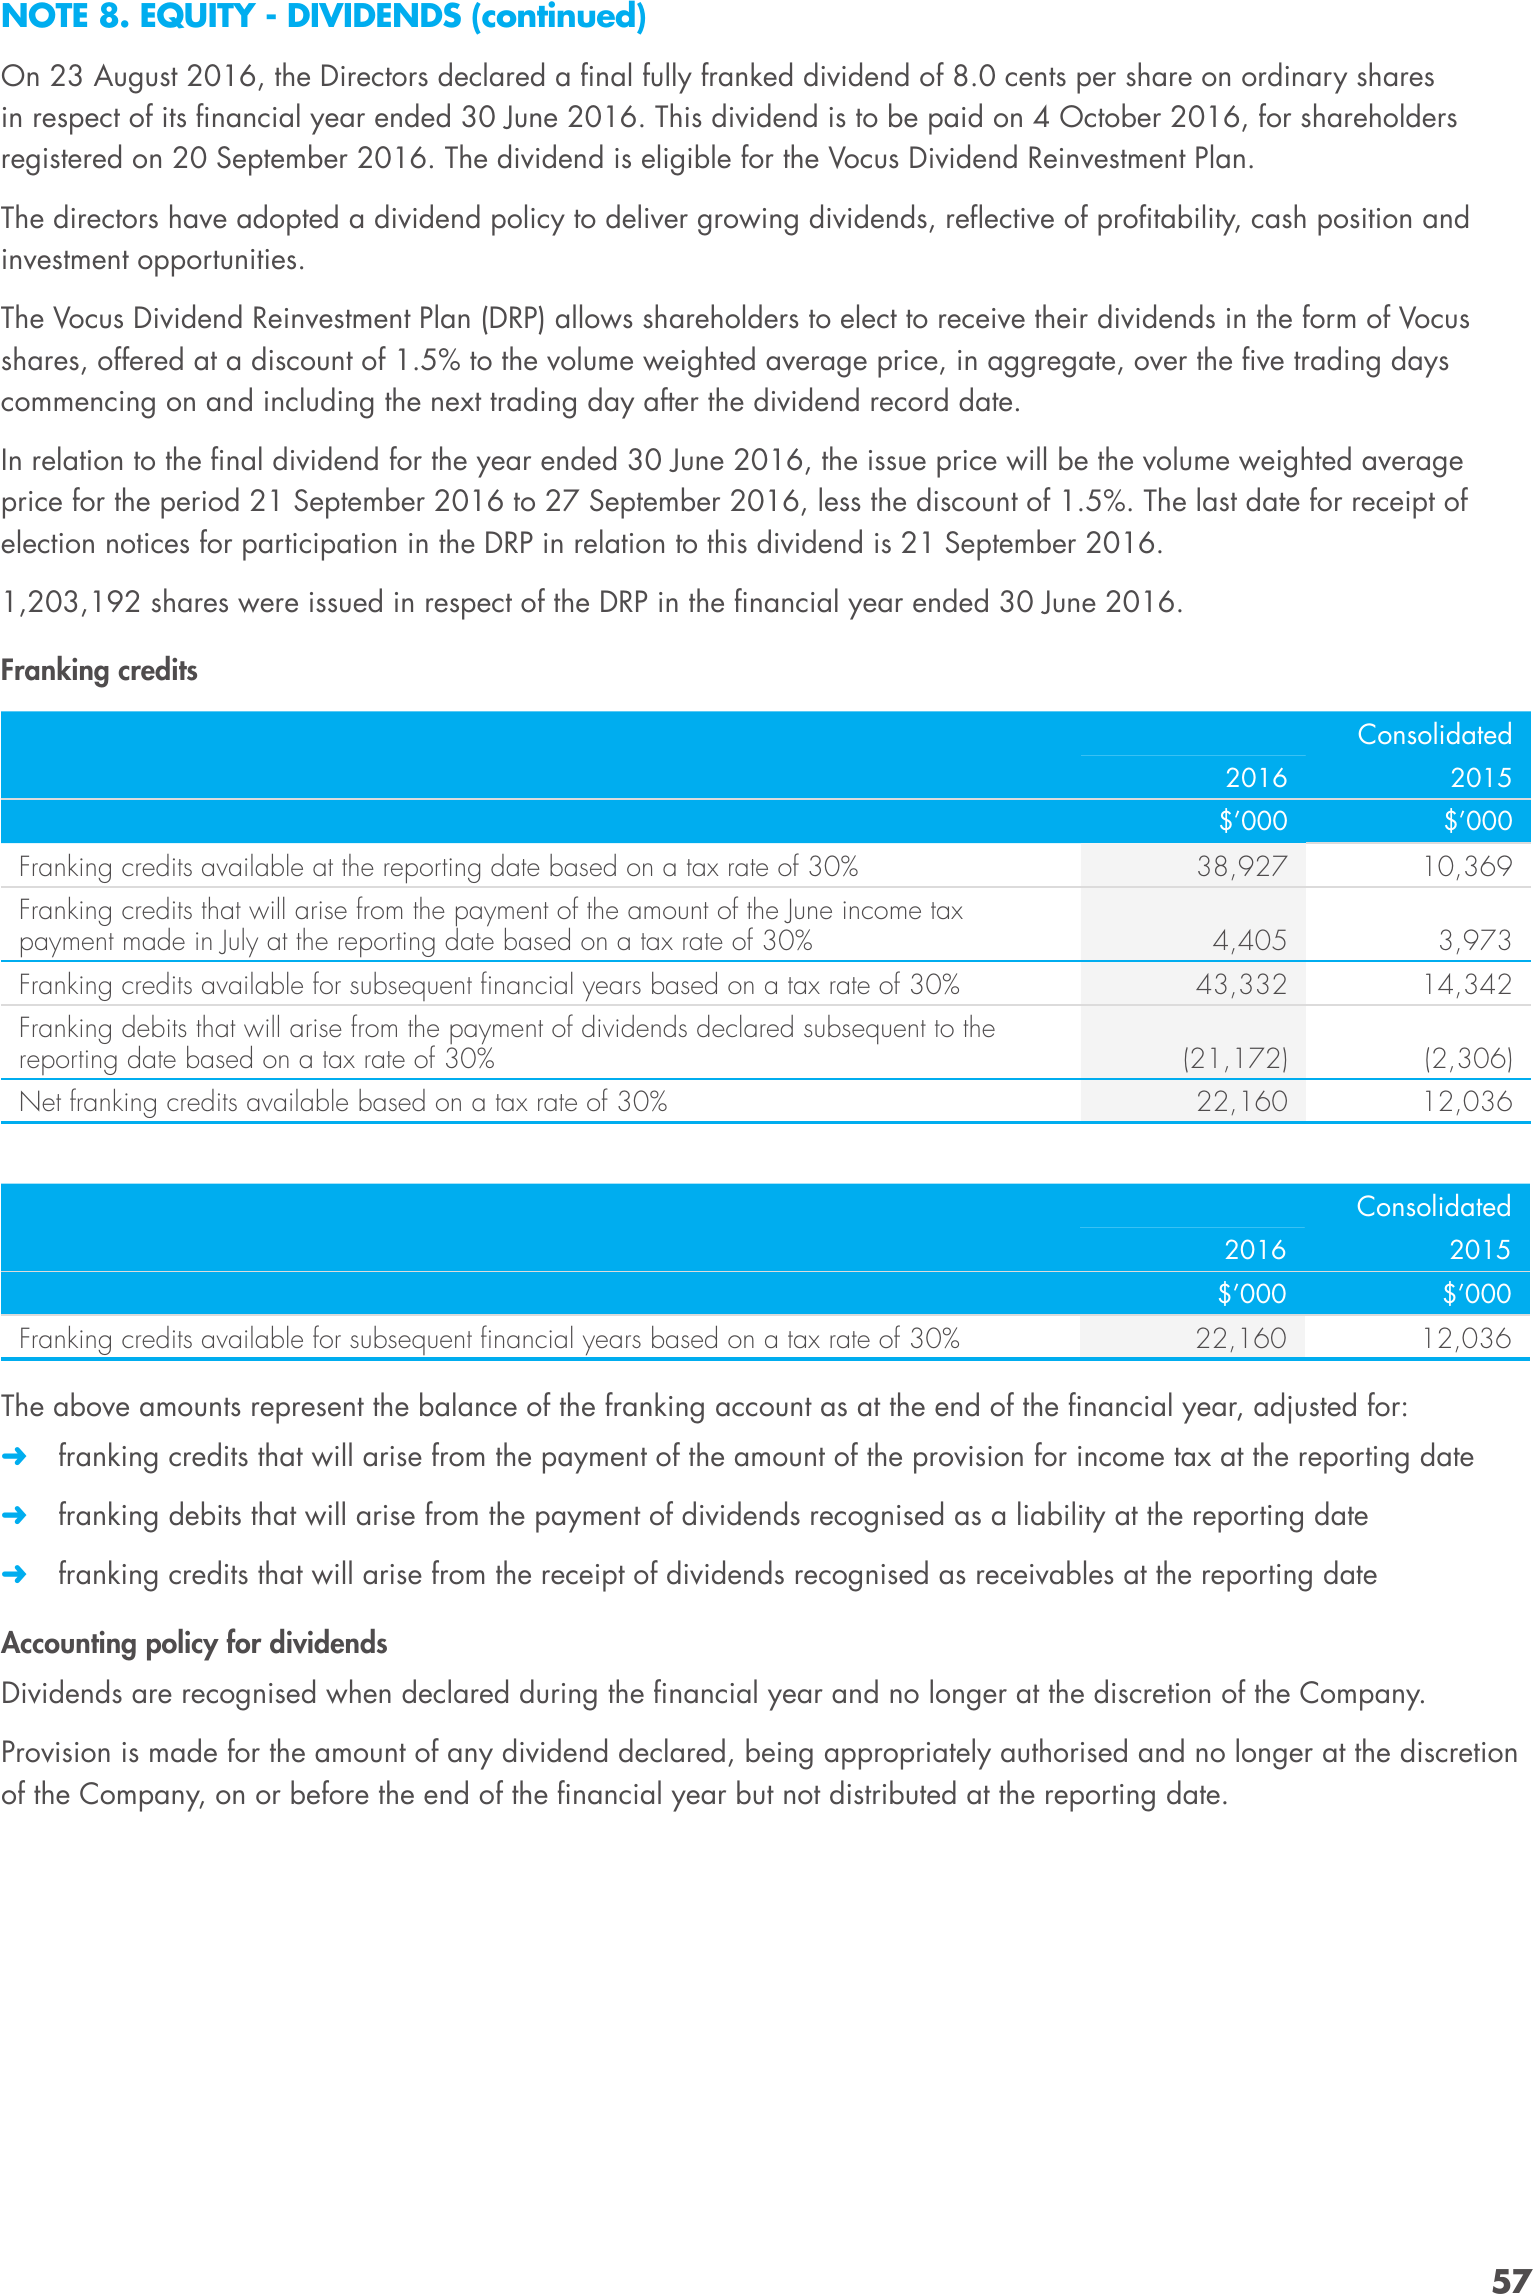
Franking credits
Consolidated
2016
Franking credits available at the reporting date based on a tax rate of 30%
2015
$’000
$’000
38,927
10,369
Franking credits that will arise from the payment of the amount of the June income tax
payment made in July at the reporting date based on a tax rate of 30%
4,405
3,973
Franking credits available for subsequent financial years based on a tax rate of 30%
43,332
14,342
Franking debits that will arise from the payment of dividends declared subsequent to the
reporting date based on a tax rate of 30%
Net franking credits available based on a tax rate of 30%
(21,172)
(2,306)
22,160
12,036
Consolidated
2016
Franking credits available for subsequent financial years based on a tax rate of 30%
2015
$’000
$’000
22,160
12,036
The above amounts represent the balance of the franking account as at the end of the financial year, adjusted for:
➜➜ franking credits that will arise from the payment of the amount of the provision for income tax at the reporting date
➜➜ franking debits that will arise from the payment of dividends recognised as a liability at the reporting date
➜➜ franking credits that will arise from the receipt of dividends recognised as receivables at the reporting date
Accounting policy for dividends
Dividends are recognised when declared during the financial year and no longer at the discretion of the Company.
Provision is made for the amount of any dividend declared, being appropriately authorised and no longer at the discretion
of the Company, on or before the end of the financial year but not distributed at the reporting date.
57
NOTES TO THE FINANCIAL STATEMENTS CONTINUED
30 JUNE 2016
NOTE 9. FINANCIAL INSTRUMENTS
Financial risk management objectives
Vocus’ activities expose it to a variety of financial risks including market risks such as foreign currency, price and interest
rate, and credit and liquidity risks.
The Audit Committee has general oversight of those financial risks identified here. In addition, the Risk Committee oversees
a formal risk management policy and risks identified are monitored by executive management on a regular basis to
minimise the potential adverse effects these risks may have on financial performance.
Overall risk management focuses on the unpredictability of financial markets and seeks to minimise potential adverse
effects on financial performance where material. Derivative financial instruments such as forward foreign exchange
contracts are used to hedge certain risk exposures or cash flow hedges where appropriate.
Derivatives are exclusively used for hedging purposes, i.e. not as trading or other speculative instruments, with the
exception of the total return swap in relation to Vocus’ 16% relevant interest in Macquarie Telecom Group Limited which is
held as a strategic investment.
Different methods are used to measure different types of risk to which Vocus is exposed. These methods include sensitivity
analysis in the case of interest rate, foreign exchange and other price risks and ageing analysis for credit risk.
As part of the acquisition of M2 Group Limited, Vocus now has an electricity and gas retailing business for which it
needs to manage commodity risk. The Wholesale Energy Risk Management Committee, which is a sub-committee of the
Risk Committee provides direct oversight over the risks relating to this business and appropriate hedging strategies are
undertaken to mitigate these risks.
Financial assets and liabilities comprise cash and cash equivalents, receivables, payables, bank loans and finance leases.
Market risk
Foreign currency risk
Certain transactions are denominated in foreign currency and is exposed to foreign currency risk through foreign exchange
rate fluctuations.
Foreign exchange risk arises from future commercial transactions and recognised financial assets and financial liabilities
denominated in a currency that is not the entity’s functional currency. The risk is measured using sensitivity analysis and
cash flow forecasting.
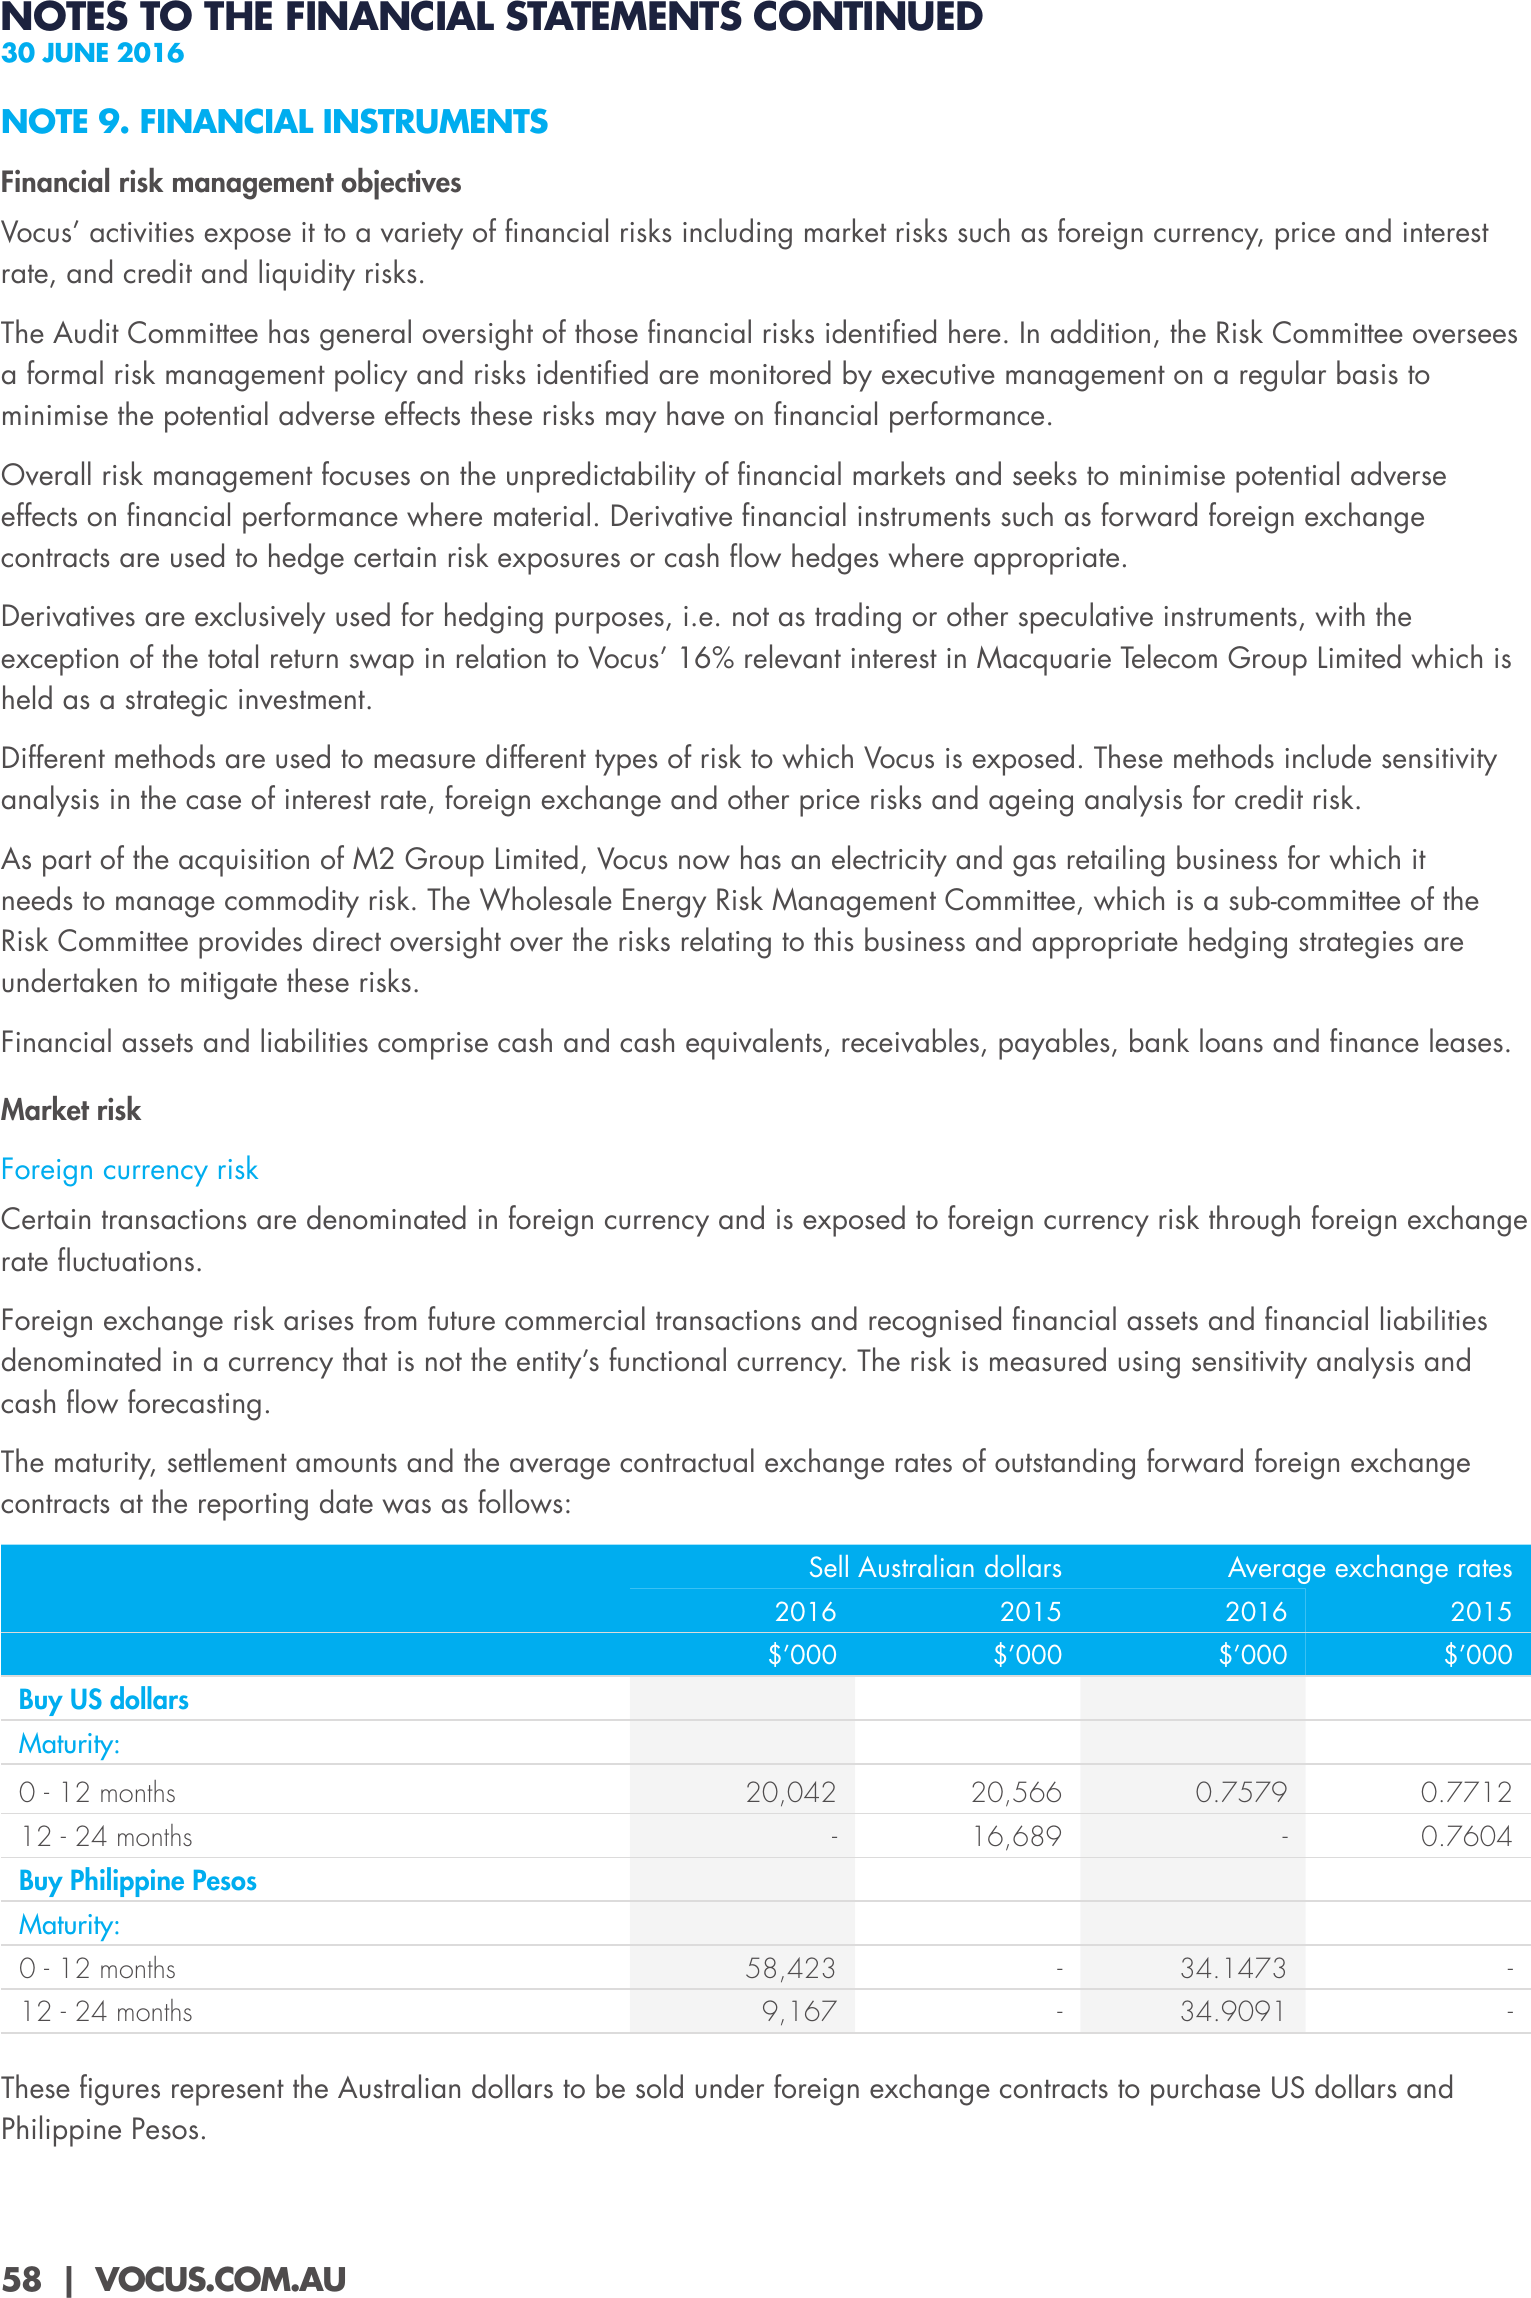
The maturity, settlement amounts and the average contractual exchange rates of outstanding forward foreign exchange
contracts at the reporting date was as follows:
Sell Australian dollars
Average exchange rates
2016
2015
2016
2015
$’000
$’000
$’000
$’000
20,042
20,566
0.7579
0.7712
-
16,689
-
0.7604
58,423
-
34.1473
-
9,167
-
34.9091
-
Buy US dollars
Maturity:
0 - 12 months
12 - 24 months
Buy Philippine Pesos
Maturity:
0 - 12 months
12 - 24 months
These figures represent the Australian dollars to be sold under foreign exchange contracts to purchase US dollars and
Philippine Pesos.
58 | VOCUS.COM.AU
NOTE 9. FINANCIAL INSTRUMENTS (continued)
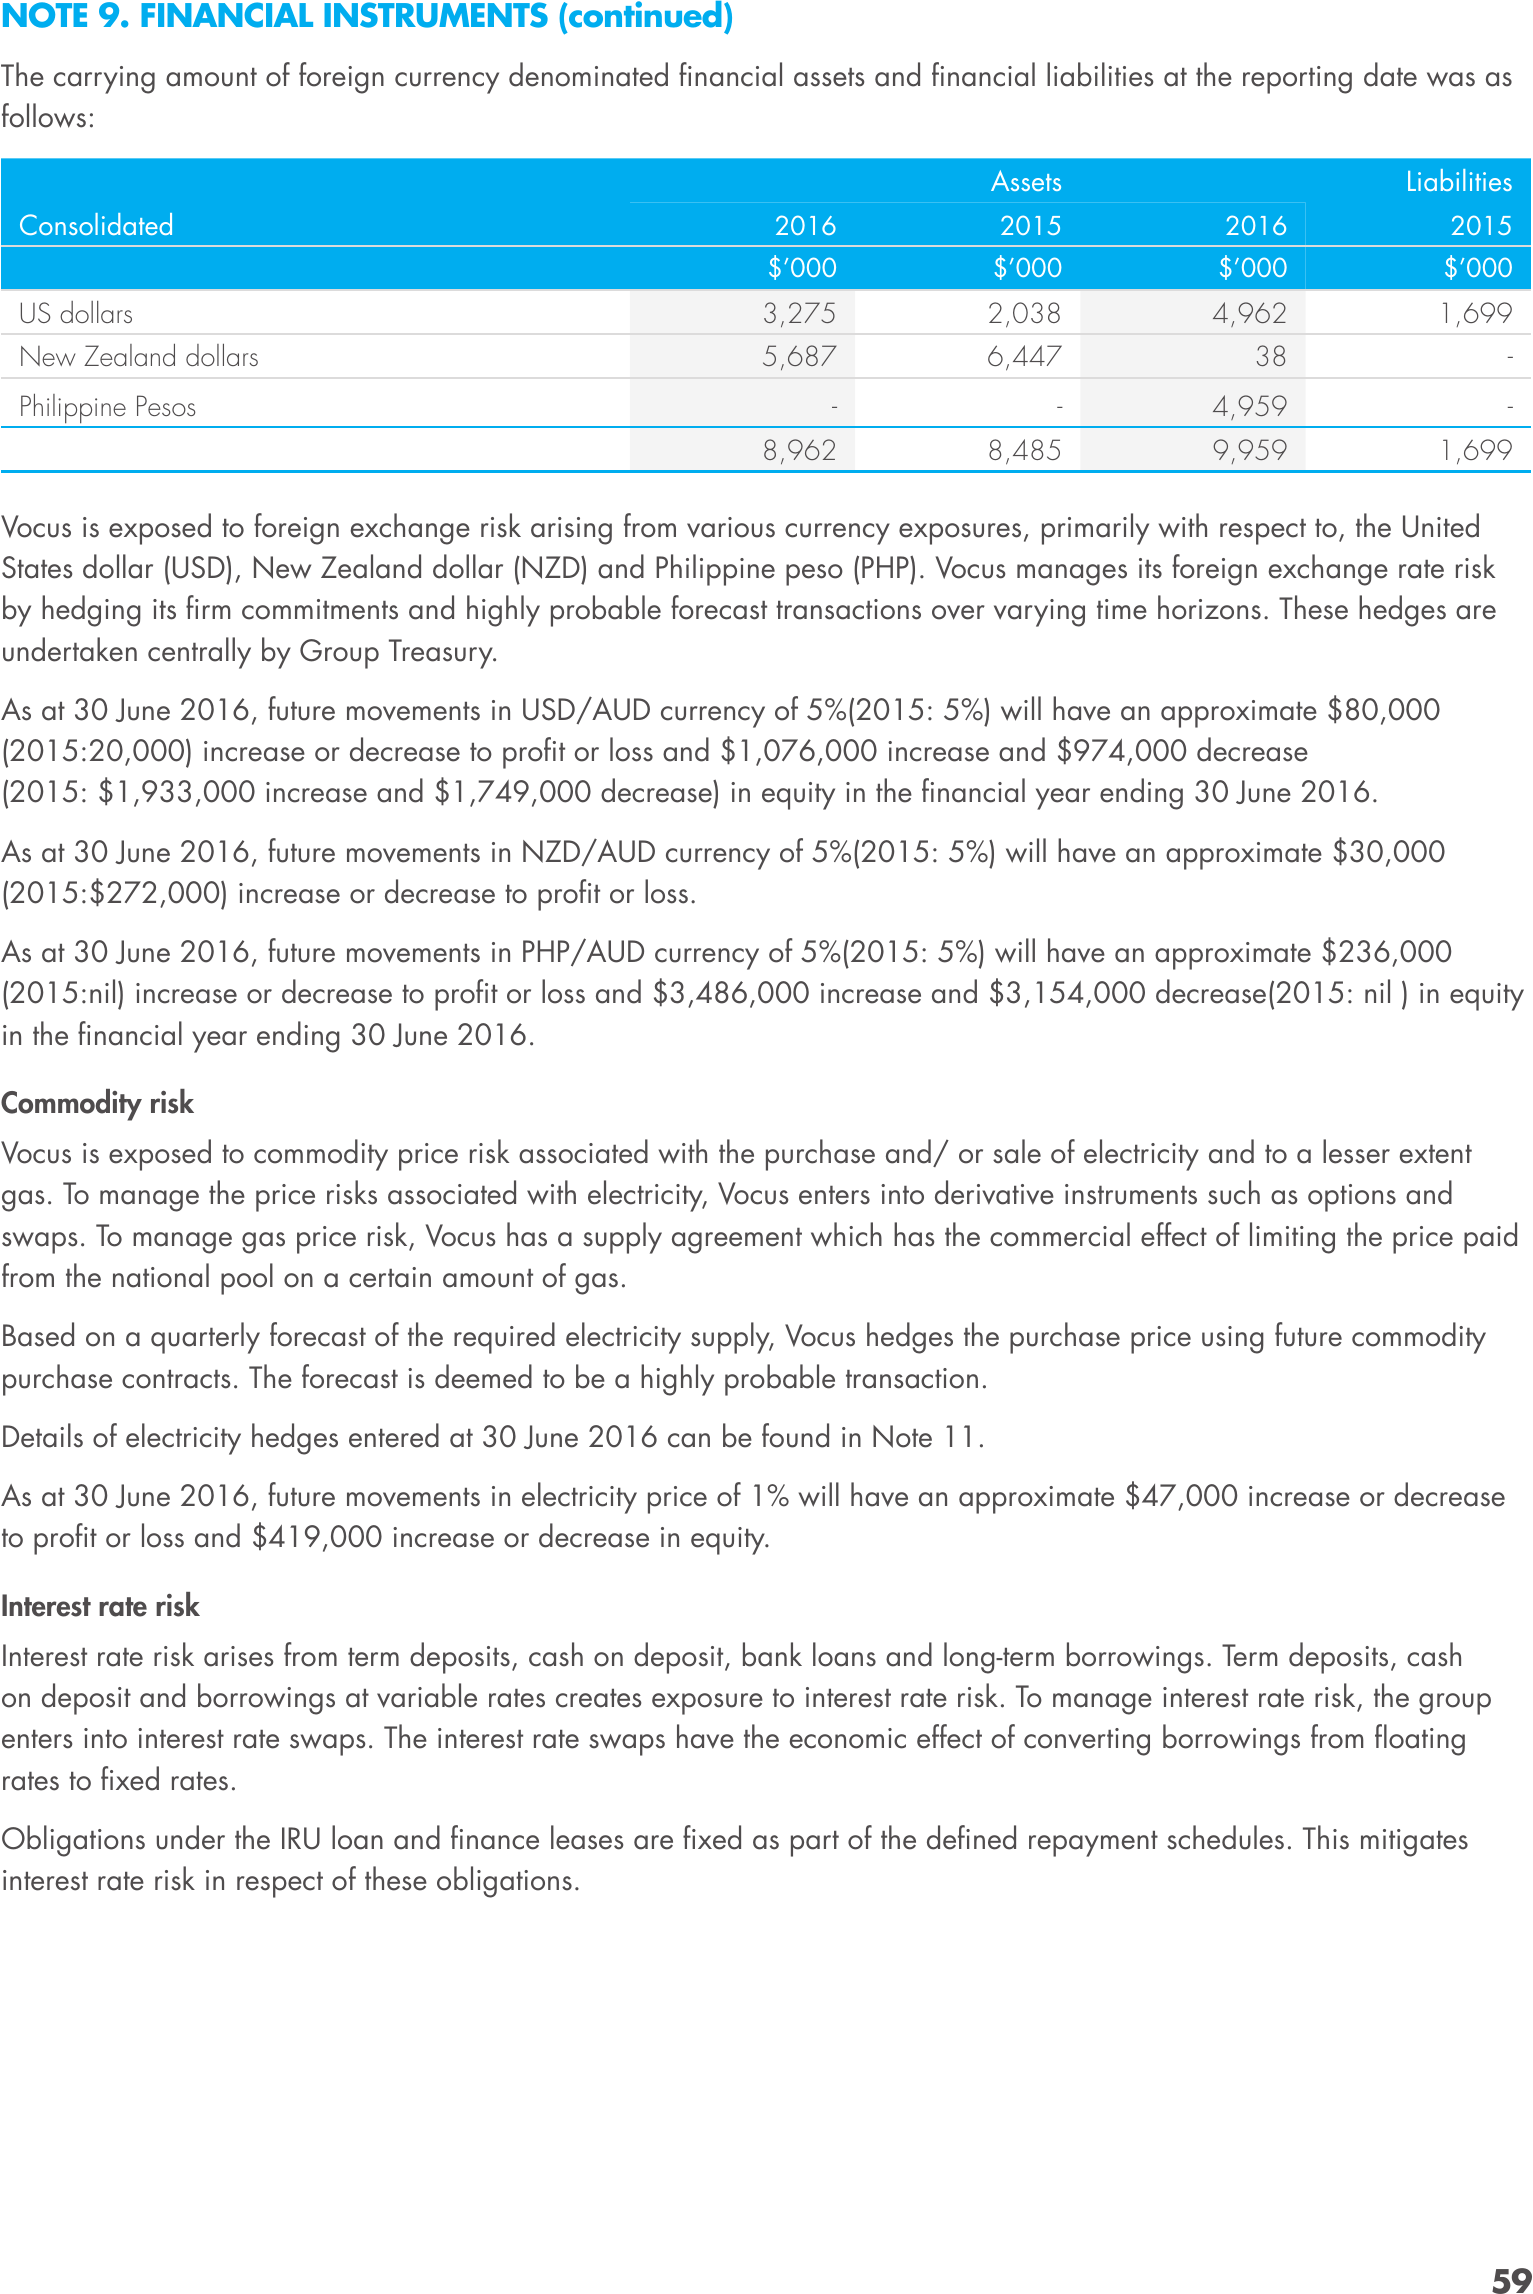
The carrying amount of foreign currency denominated financial assets and financial liabilities at the reporting date was as
follows:
Assets
Consolidated
2016
2015
Liabilities
2016
2015
$’000
$’000
$’000
$’000
US dollars
3,275
2,038
4,962
1,699
New Zealand dollars
5,687
6,447
38
-
-
-
4,959
-
8,962
8,485
9,959
1,699
Philippine Pesos
Vocus is exposed to foreign exchange risk arising from various currency exposures, primarily with respect to, the United
States dollar (USD), New Zealand dollar (NZD) and Philippine peso (PHP). Vocus manages its foreign exchange rate risk
by hedging its firm commitments and highly probable forecast transactions over varying time horizons. These hedges are
undertaken centrally by Group Treasury.
As at 30 June 2016, future movements in USD/AUD currency of 5%(2015: 5%) will have an approximate $80,000
(2015:20,000) increase or decrease to profit or loss and $1,076,000 increase and $974,000 decrease
(2015: $1,933,000 increase and $1,749,000 decrease) in equity in the financial year ending 30 June 2016.
As at 30 June 2016, future movements in NZD/AUD currency of 5%(2015: 5%) will have an approximate $30,000
(2015:$272,000) increase or decrease to profit or loss.
As at 30 June 2016, future movements in PHP/AUD currency of 5%(2015: 5%) will have an approximate $236,000
(2015:nil) increase or decrease to profit or loss and $3,486,000 increase and $3,154,000 decrease(2015: nil ) in equity
in the financial year ending 30 June 2016.
Commodity risk
Vocus is exposed to commodity price risk associated with the purchase and/ or sale of electricity and to a lesser extent
gas. To manage the price risks associated with electricity, Vocus enters into derivative instruments such as options and
swaps. To manage gas price risk, Vocus has a supply agreement which has the commercial effect of limiting the price paid
from the national pool on a certain amount of gas.
Based on a quarterly forecast of the required electricity supply, Vocus hedges the purchase price using future commodity
purchase contracts. The forecast is deemed to be a highly probable transaction.
Details of electricity hedges entered at 30 June 2016 can be found in Note 11.
As at 30 June 2016, future movements in electricity price of 1% will have an approximate $47,000 increase or decrease
to profit or loss and $419,000 increase or decrease in equity.
Interest rate risk
Interest rate risk arises from term deposits, cash on deposit, bank loans and long-term borrowings. Term deposits, cash
on deposit and borrowings at variable rates creates exposure to interest rate risk. To manage interest rate risk, the group
enters into interest rate swaps. The interest rate swaps have the economic effect of converting borrowings from floating
rates to fixed rates.
Obligations under the IRU loan and finance leases are fixed as part of the defined repayment schedules. This mitigates
interest rate risk in respect of these obligations.
59
NOTES TO THE FINANCIAL STATEMENTS CONTINUED
30 JUNE 2016
NOTE 9. FINANCIAL INSTRUMENTS (continued)
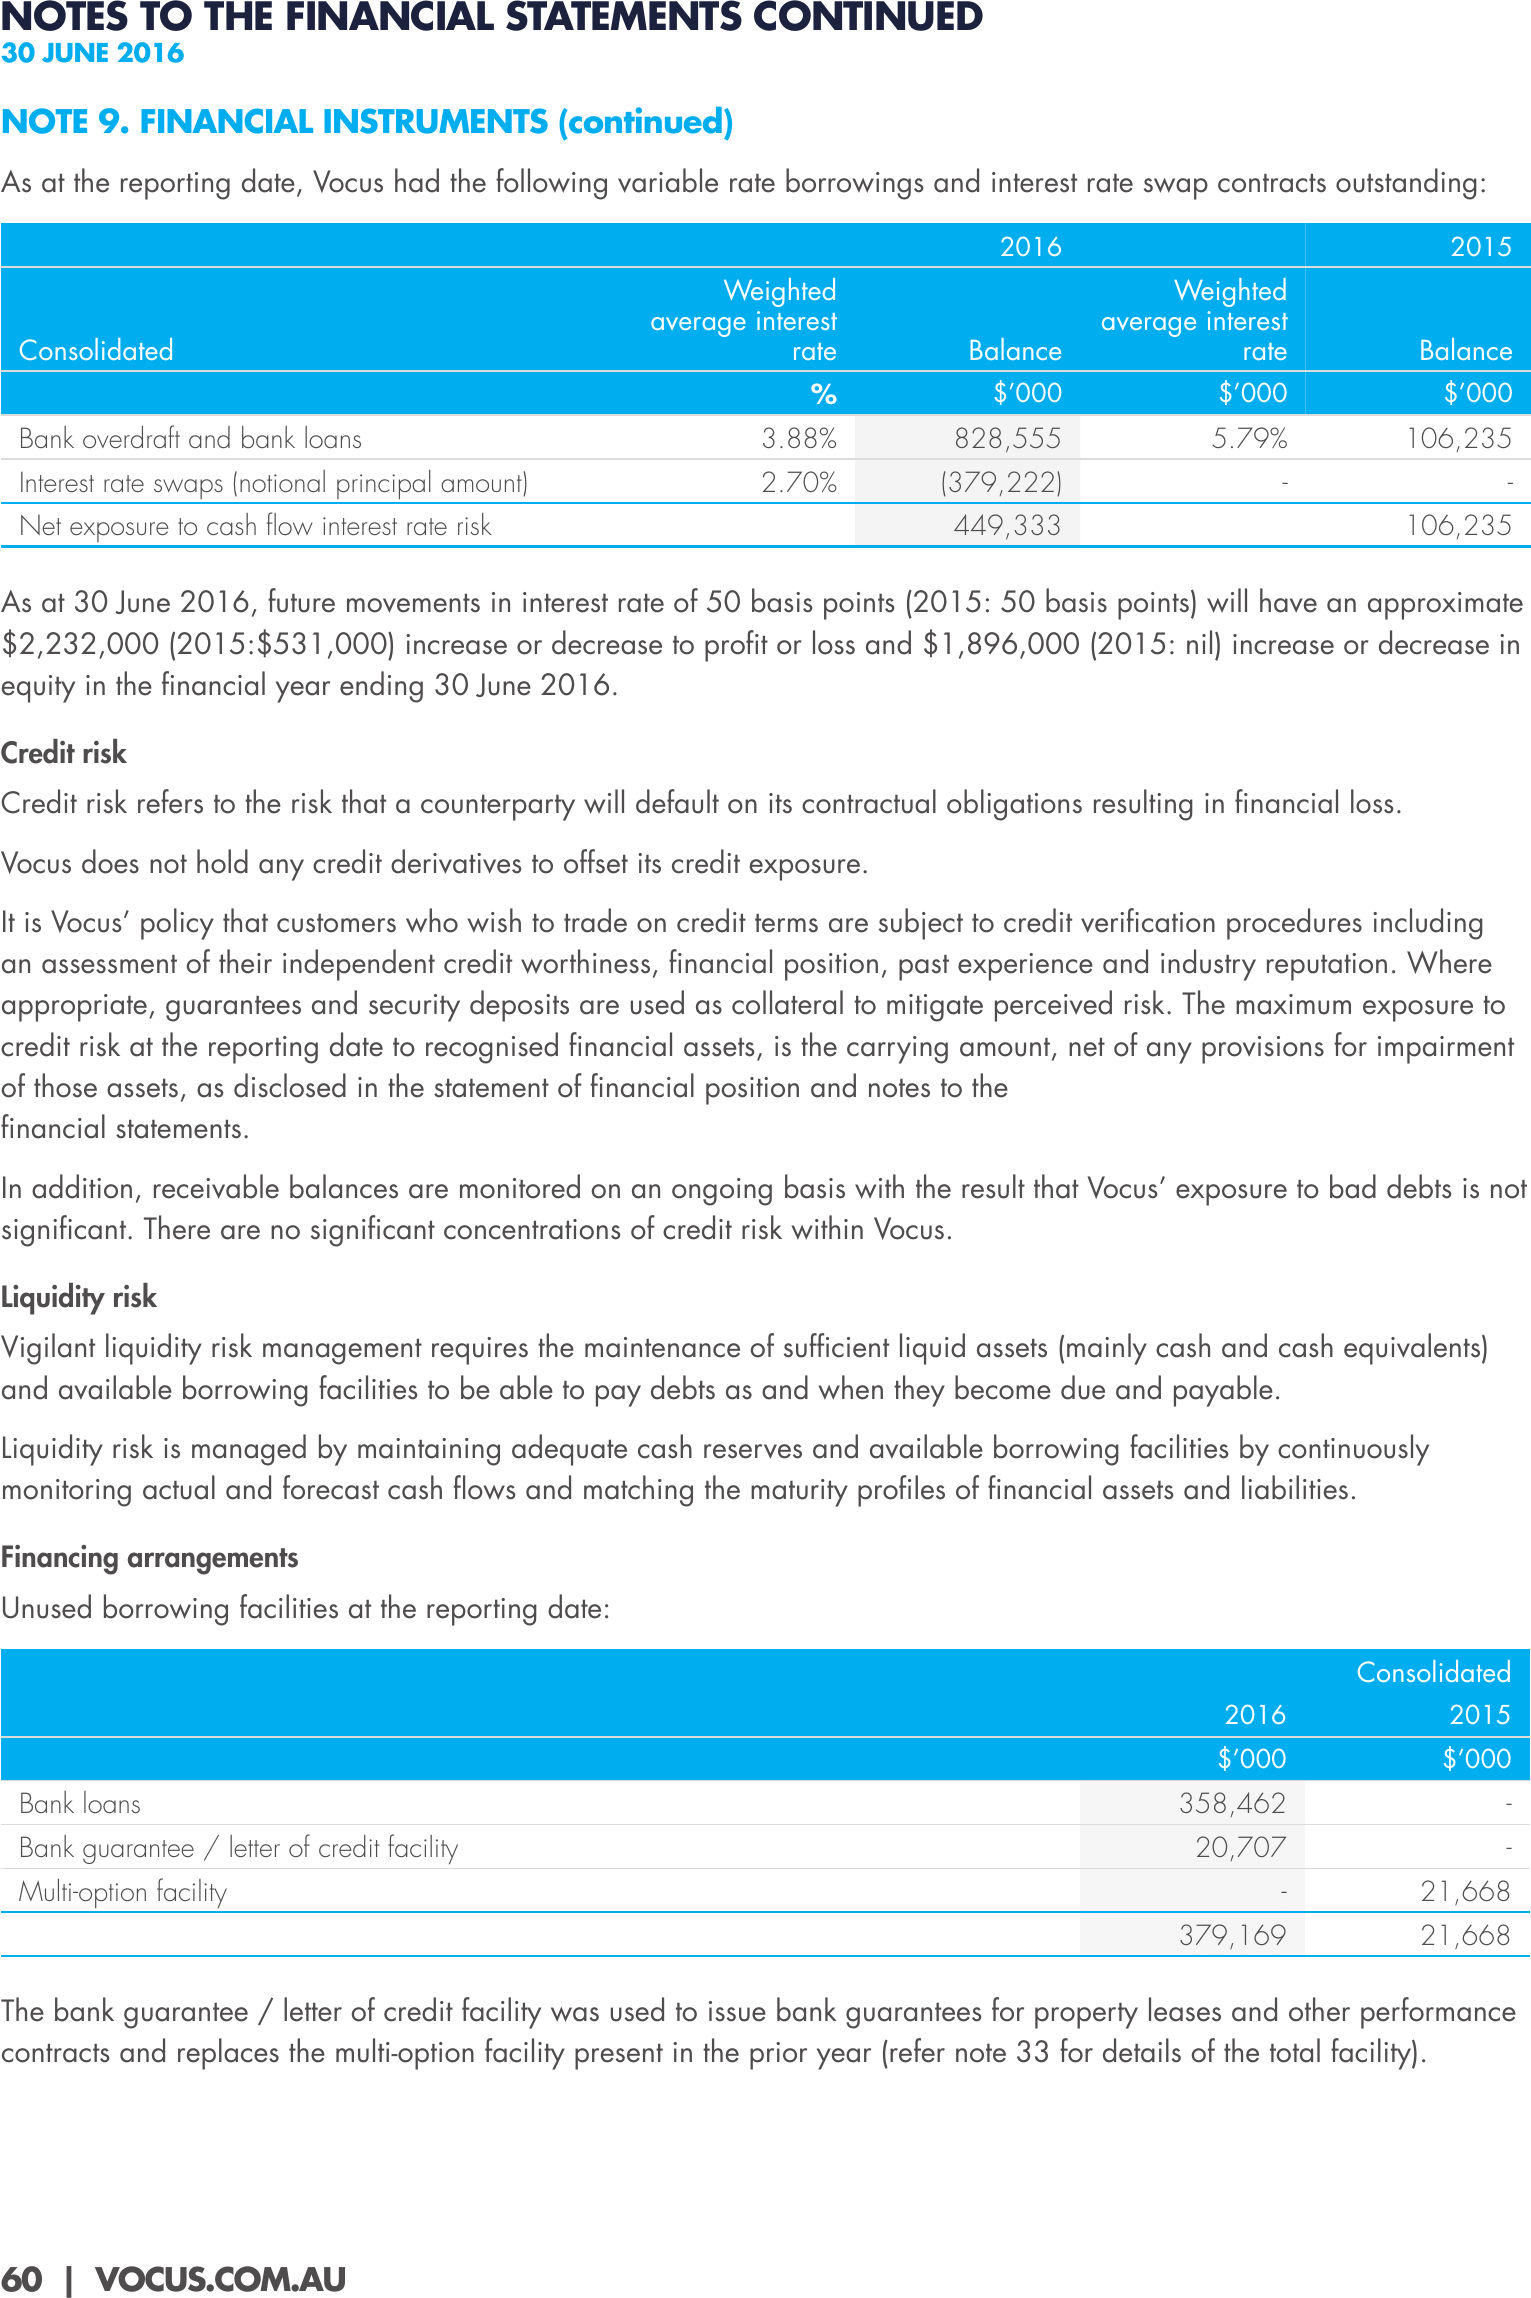
As at the reporting date, Vocus had the following variable rate borrowings and interest rate swap contracts outstanding:
2016
Consolidated
Weighted
average interest
rate
Balance
2015
Weighted
average interest
rate
Balance
%
$’000
$’000
$’000
Bank overdraft and bank loans
3.88%
828,555
5.79%
106,235
Interest rate swaps (notional principal amount)
2.70%
(379,222)
-
Net exposure to cash flow interest rate risk
-
449,333
106,235
As at 30 June 2016, future movements in interest rate of 50 basis points (2015: 50 basis points) will have an approximate
$2,232,000 (2015:$531,000) increase or decrease to profit or loss and $1,896,000 (2015: nil) increase or decrease in
equity in the financial year ending 30 June 2016.
Credit risk
Credit risk refers to the risk that a counterparty will default on its contractual obligations resulting in financial loss.
Vocus does not hold any credit derivatives to offset its credit exposure.
It is Vocus’ policy that customers who wish to trade on credit terms are subject to credit verification procedures including
an assessment of their independent credit worthiness, financial position, past experience and industry reputation. Where
appropriate, guarantees and security deposits are used as collateral to mitigate perceived risk. The maximum exposure to
credit risk at the reporting date to recognised financial assets, is the carrying amount, net of any provisions for impairment
of those assets, as disclosed in the statement of financial position and notes to the
financial statements.
In addition, receivable balances are monitored on an ongoing basis with the result that Vocus’ exposure to bad debts is not
significant. There are no significant concentrations of credit risk within Vocus.
Liquidity risk
Vigilant liquidity risk management requires the maintenance of sufficient liquid assets (mainly cash and cash equivalents)
and available borrowing facilities to be able to pay debts as and when they become due and payable.
Liquidity risk is managed by maintaining adequate cash reserves and available borrowing facilities by continuously
monitoring actual and forecast cash flows and matching the maturity profiles of financial assets and liabilities.
Financing arrangements
Unused borrowing facilities at the reporting date:
Consolidated
2016
Bank loans
2015
$’000
$’000
Multi-option facility
358,462
-
20,707
-
-
21,668
379,169
Bank guarantee / letter of credit facility
21,668
The bank guarantee / letter of credit facility was used to issue bank guarantees for property leases and other performance
contracts and replaces the multi-option facility present in the prior year (refer note 33 for details of the total facility).
60 | VOCUS.COM.AU
NOTE 9. FINANCIAL INSTRUMENTS (continued)
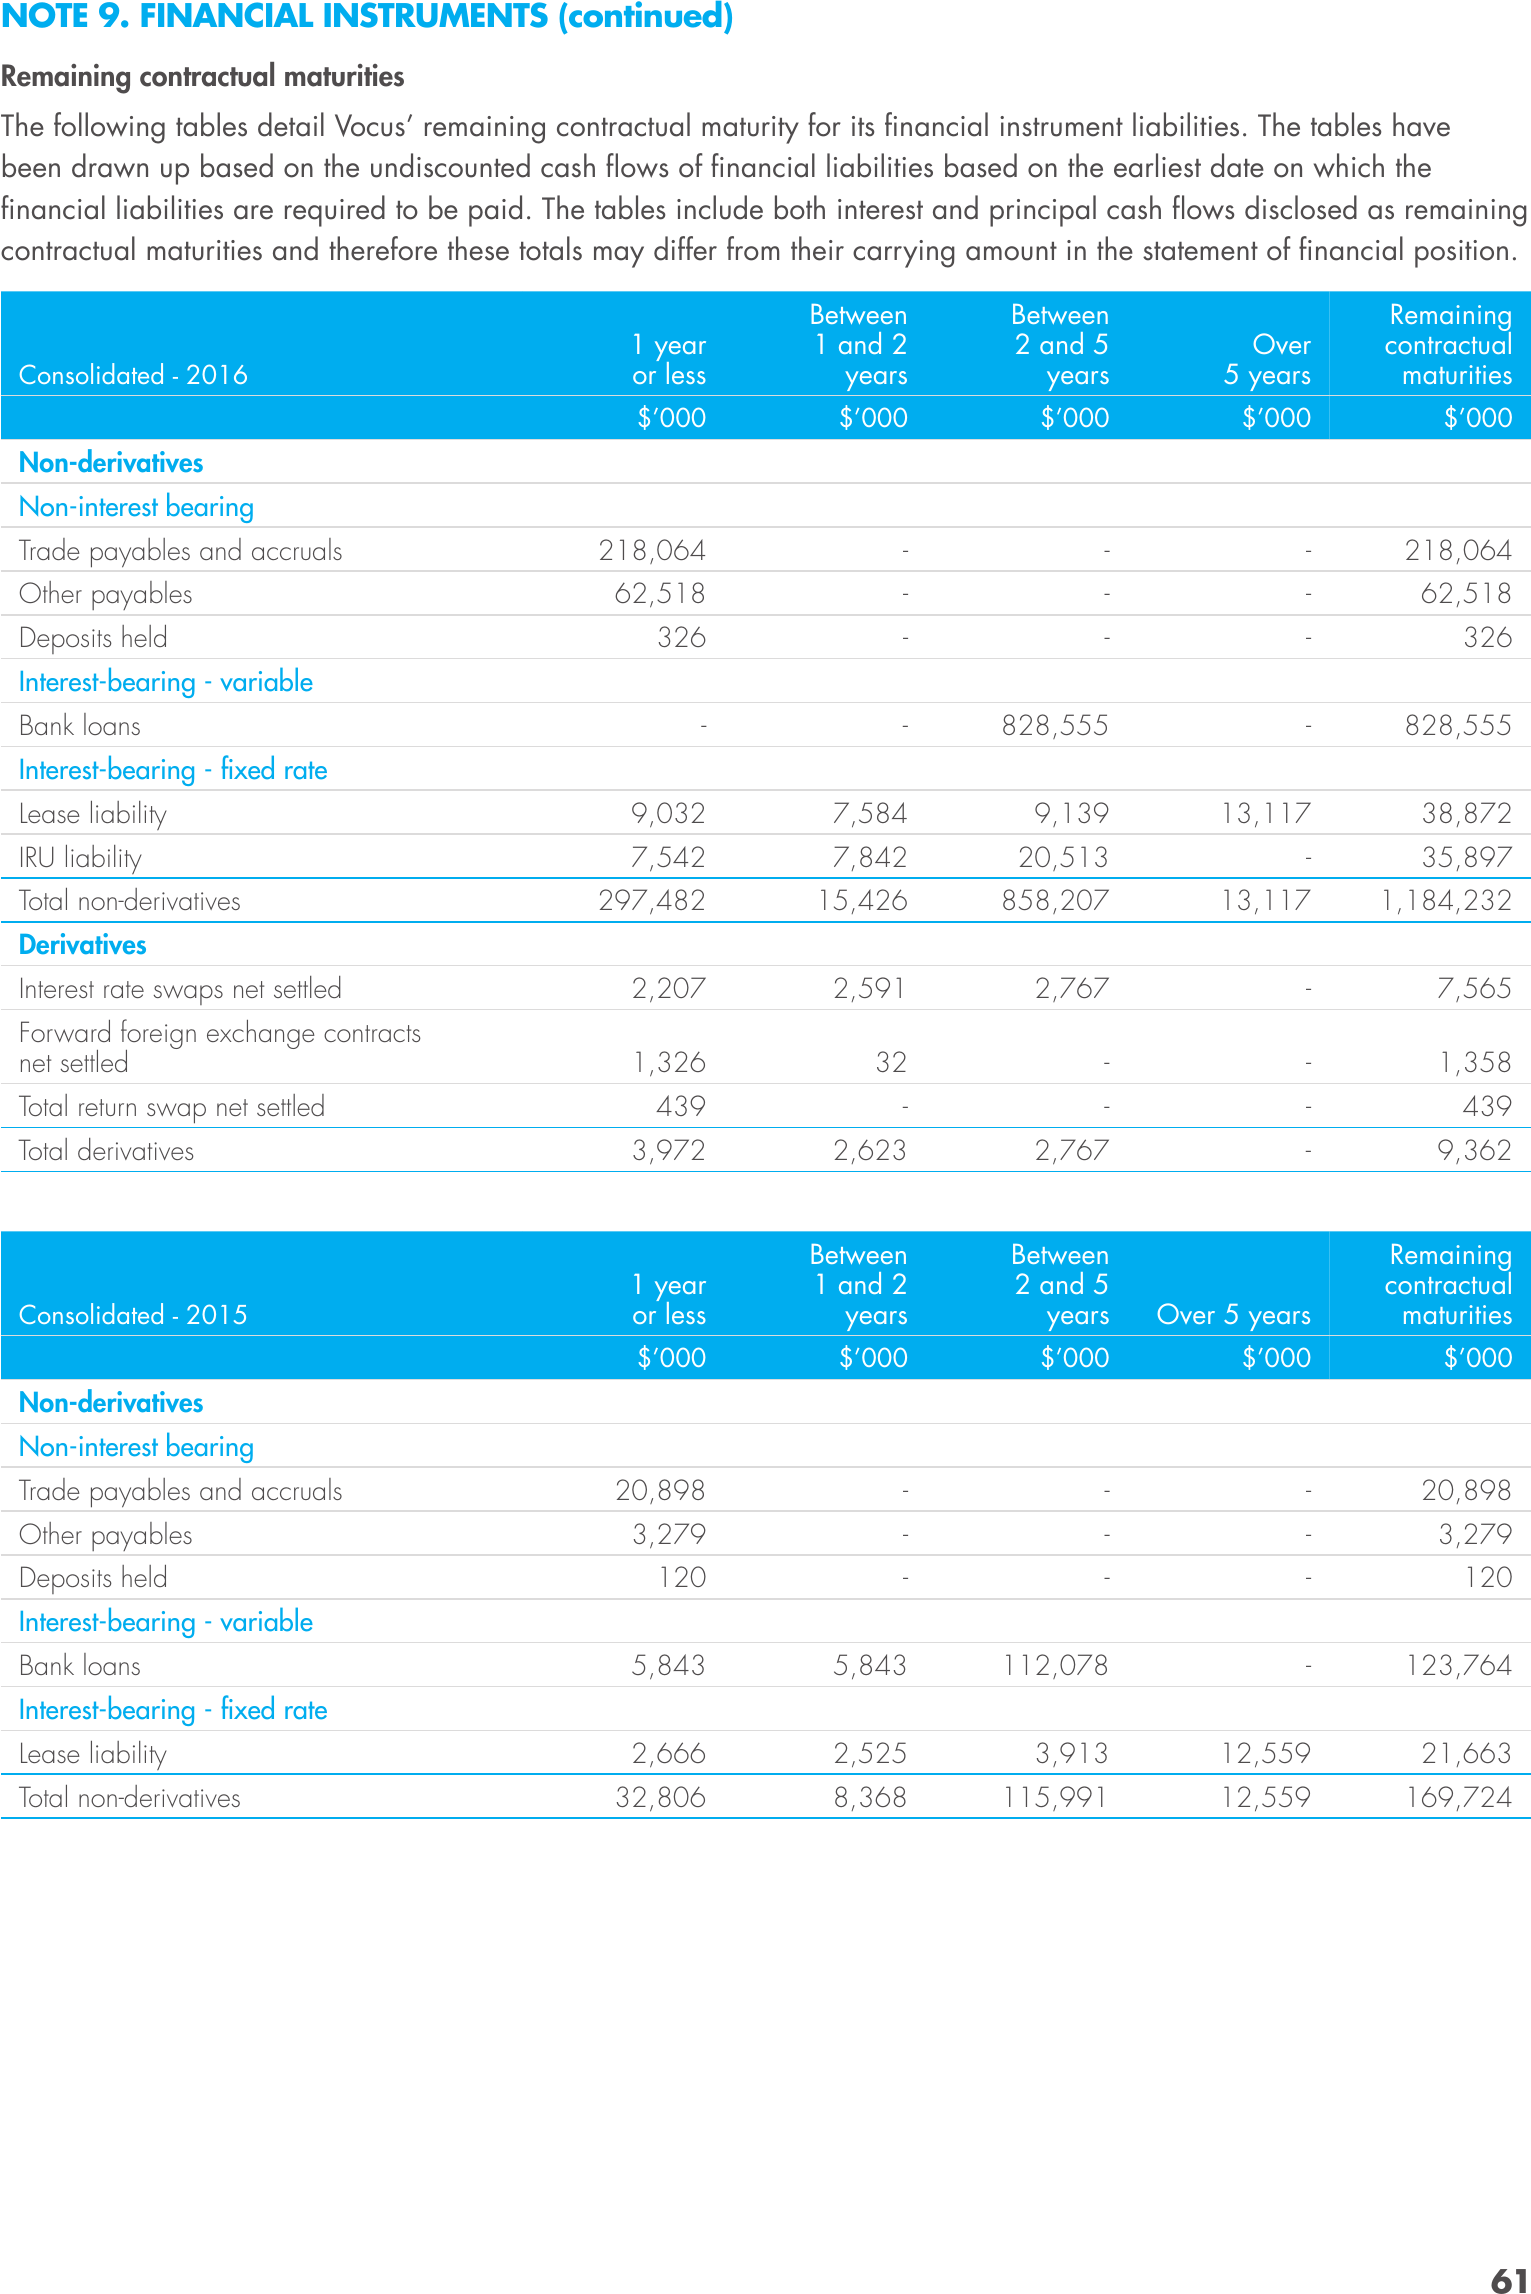
Remaining contractual maturities
The following tables detail Vocus’ remaining contractual maturity for its financial instrument liabilities. The tables have
been drawn up based on the undiscounted cash flows of financial liabilities based on the earliest date on which the
financial liabilities are required to be paid. The tables include both interest and principal cash flows disclosed as remaining
contractual maturities and therefore these totals may differ from their carrying amount in the statement of financial position.
Between
1 and 2
years
Between
2 and 5
years
Over
5 years
Remaining
contractual
maturities
$’000
Consolidated - 2016
1 year
or less
$’000
$’000
$’000
$’000
Non-derivatives
Non-interest bearing
Trade payables and accruals
Other payables
Deposits held
218,064
-
-
-
218,064
62,518
-
-
-
62,518
326
-
-
-
326
-
-
828,555
-
828,555
Interest-bearing - variable
Bank loans
Interest-bearing - fixed rate
Lease liability
9,032
7,584
9,139
13,117
38,872
IRU liability
7,542
7,842
20,513
-
35,897
297,482
15,426
858,207
13,117
1,184,232
Interest rate swaps net settled
2,207
2,591
2,767
-
7,565
Forward foreign exchange contracts
net settled
1,326
32
-
-
1,358
Total non-derivatives
Derivatives
439
-
-
-
439
Total derivatives
Total return swap net settled
3,972
2,623
2,767
-
9,362
Consolidated - 2015
1 year
or less
Between
1 and 2
years
Between
2 and 5
years
Over 5 years
Remaining
contractual
maturities
$’000
$’000
$’000
$’000
$’000
Non-derivatives
Non-interest bearing
Trade payables and accruals
Other payables
Deposits held
20,898
-
-
-
20,898
3,279
-
-
-
3,279
120
-
-
-
120
5,843
5,843
112,078
-
123,764
Interest-bearing - variable
Bank loans
Interest-bearing - fixed rate
Lease liability
Total non-derivatives
2,666
2,525
3,913
12,559
21,663
32,806
8,368
115,991
12,559
169,724
61
NOTES TO THE FINANCIAL STATEMENTS CONTINUED
30 JUNE 2016
NOTE 10. FAIR VALUE MEASUREMENT
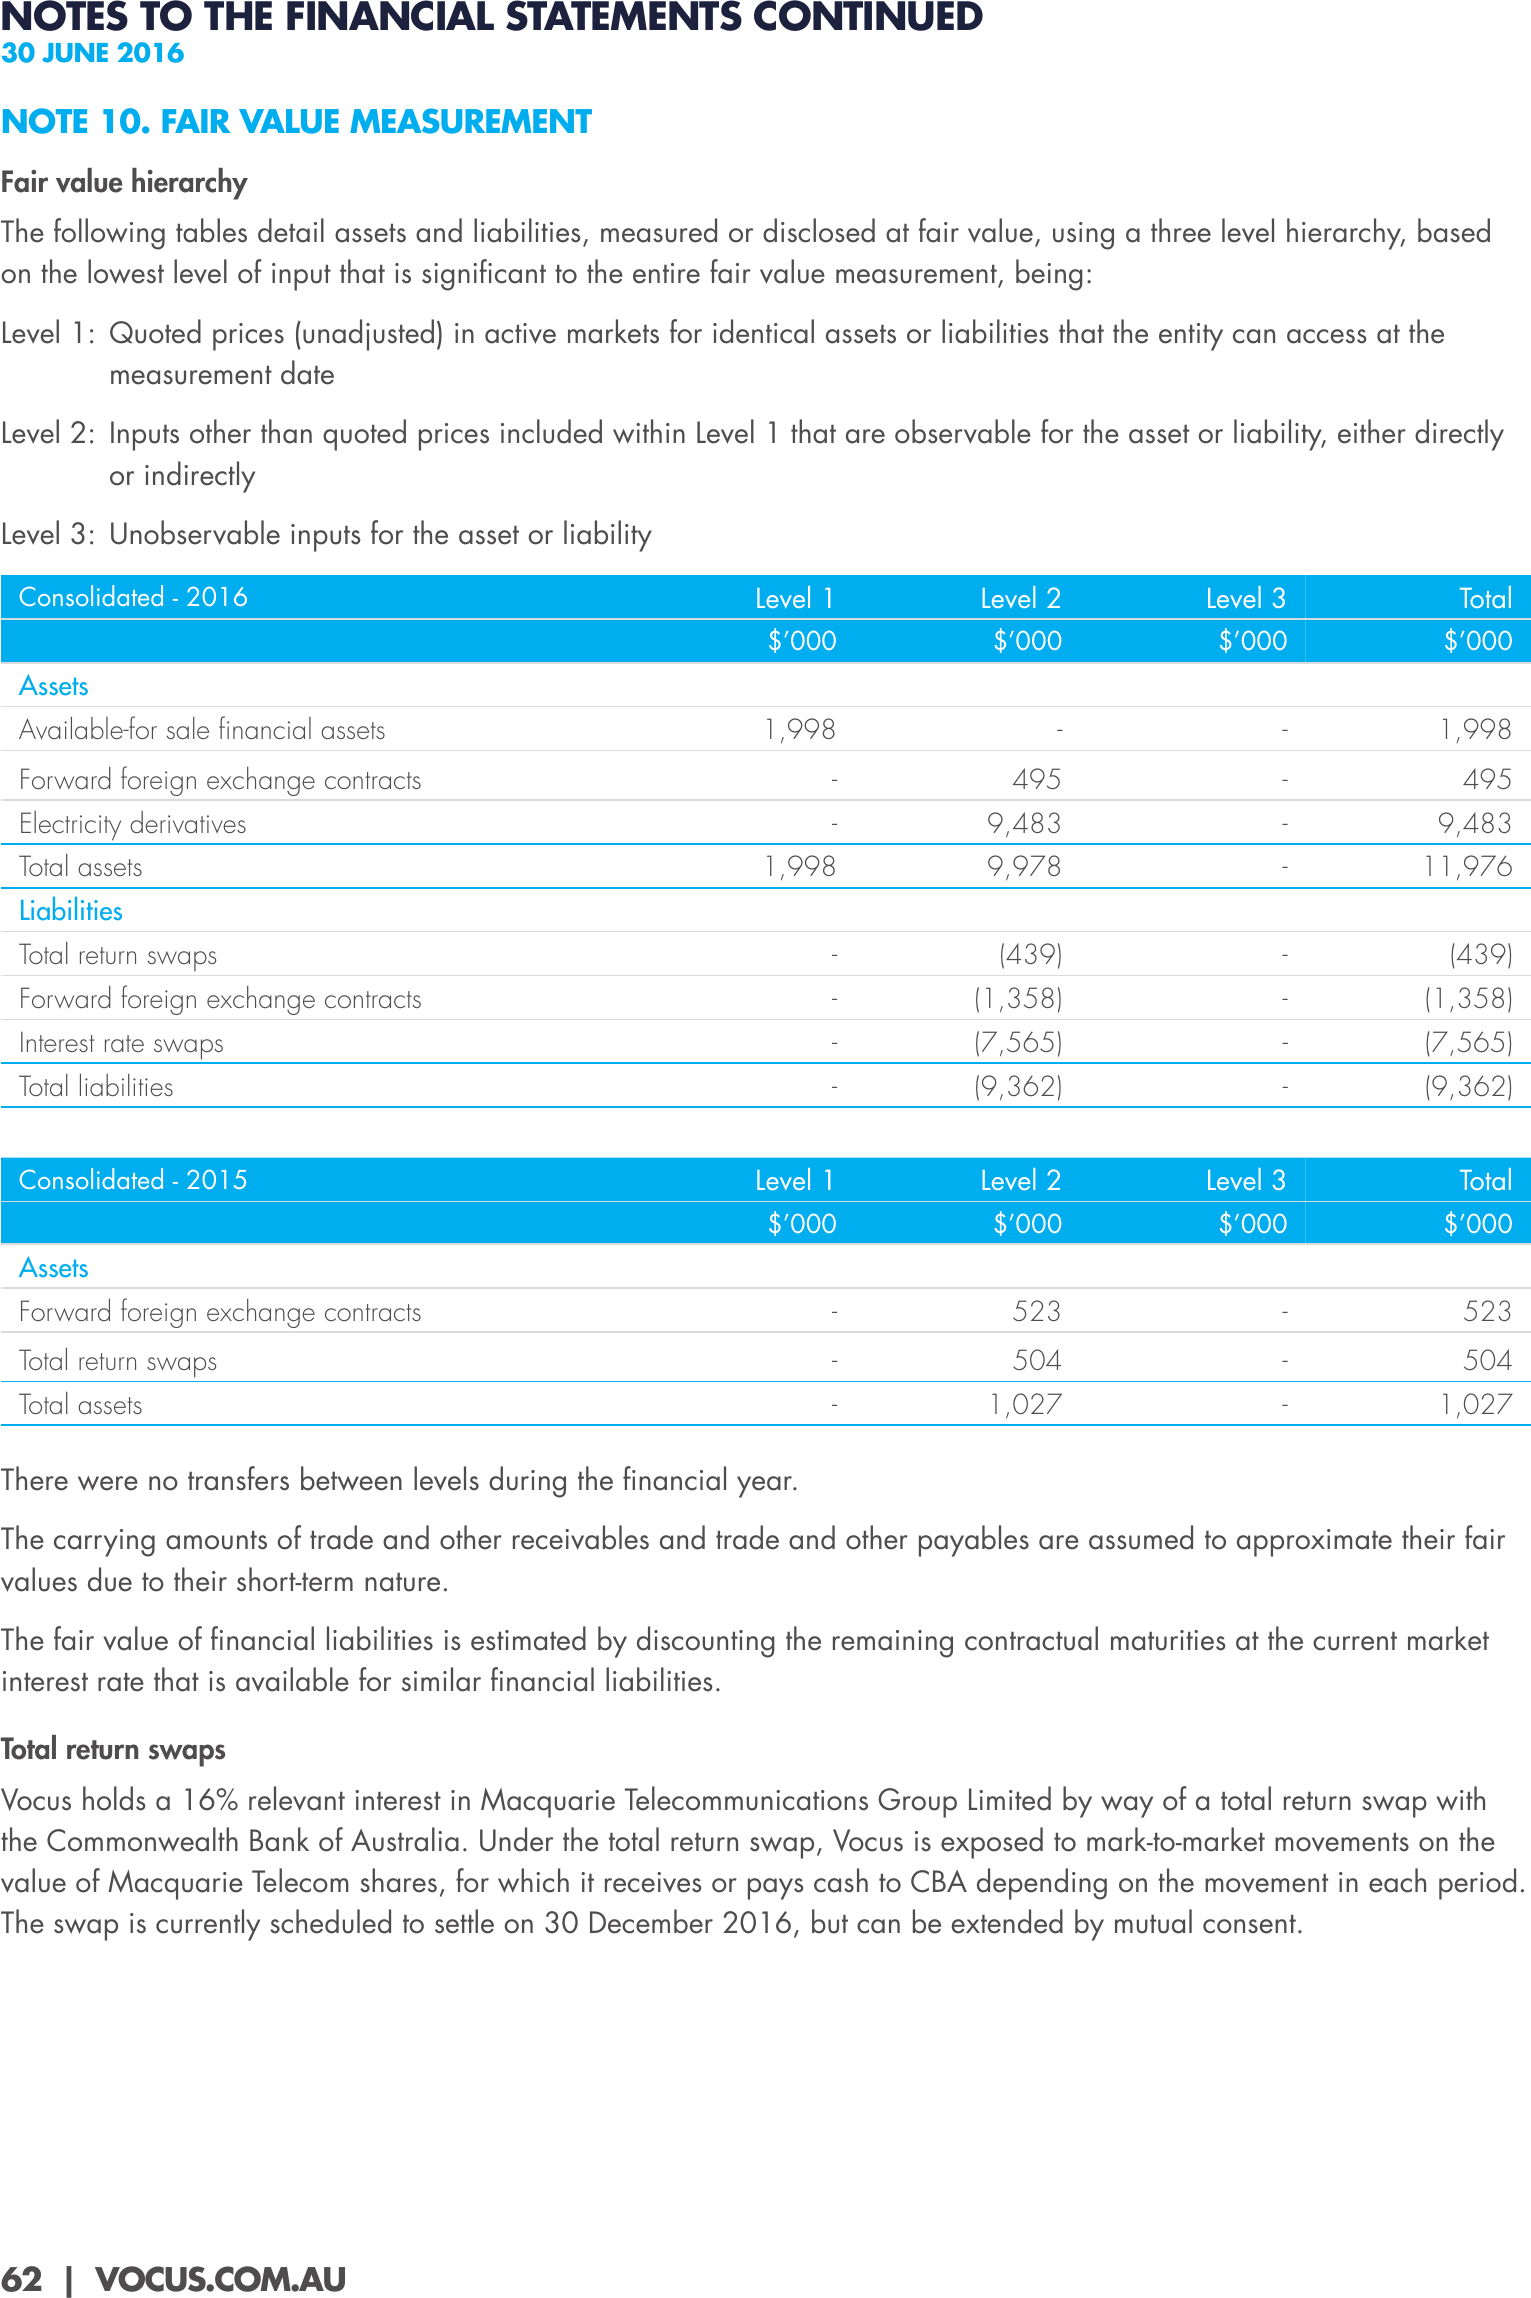
Fair value hierarchy
The following tables detail assets and liabilities, measured or disclosed at fair value, using a three level hierarchy, based
on the lowest level of input that is significant to the entire fair value measurement, being:
Level 1: Quoted prices (unadjusted) in active markets for identical assets or liabilities that the entity can access at the
measurement date
Level 2: Inputs other than quoted prices included within Level 1 that are observable for the asset or liability, either directly
or indirectly
Level 3: Unobservable inputs for the asset or liability
Level 1
Level 2
Level 3
Total
$’000
Consolidated - 2016
$’000
$’000
$’000
1,998
-
-
1,998
Assets
Available-for sale financial assets
Forward foreign exchange contracts
-
495
-
495
Electricity derivatives
-
9,483
-
9,483
1,998
9,978
-
11,976
Total assets
Liabilities
Total return swaps
-
(439)
-
(439)
Forward foreign exchange contracts
-
(1,358)
-
(1,358)
Interest rate swaps
-
(7,565)
-
(7,565)
Total liabilities
-
(9,362)
-
(9,362)
Level 1
Level 2
Level 3
Total
$’000
$’000
$’000
$’000
Forward foreign exchange contracts
-
523
-
523
Total return swaps
-
504
-
504
Total assets
-
1,027
-
1,027
Consolidated - 2015
Assets
There were no transfers between levels during the financial year.
The carrying amounts of trade and other receivables and trade and other payables are assumed to approximate their fair
values due to their short-term nature.
The fair value of financial liabilities is estimated by discounting the remaining contractual maturities at the current market
interest rate that is available for similar financial liabilities.
Total return swaps
Vocus holds a 16% relevant interest in Macquarie Telecommunications Group Limited by way of a total return swap with
the Commonwealth Bank of Australia. Under the total return swap, Vocus is exposed to mark-to-market movements on the
value of Macquarie Telecom shares, for which it receives or pays cash to CBA depending on the movement in each period.
The swap is currently scheduled to settle on 30 December 2016, but can be extended by mutual consent.
62 | VOCUS.COM.AU
NOTE 10. FAIR VALUE MEASUREMENT (continued)
Valuation techniques for fair value measurements
Available for sale financial assets uses observable values such as publically available equity prices at the end of the
reporting period in the valuation and is classified as in the hierarchy as level 1.
The fair value of derivative financial instruments that are not traded on an active market is determined by using valuation
methodologies and assumptions that are based on market conditions existing at the valuation date. These include:
➜➜ The use of forward electricity price curve derived from various inputs such as electricity futures market is used in
calculating electricity derivatives.
➜➜ The interest rate yield curve and applying the net present value to future cash flows are techniques used in valuing
interest rate swaps.
➜➜ The fair value of forward exchange contracts are determined by using forward exchange market rates in valuing
forward exchange contracts.
➜➜ The fair value of total return swap contracts are derived from the market value of the underlying security, being the
shares of Macquarie Telecommunications Group Limited, adjusted for receipts/payments made under the swap to
balance date.
Accounting policy for fair value measurement
When an asset or liability, financial or non-financial, is measured at fair value for recognition or disclosure purposes,
the fair value is based on the price that would be received to sell an asset or paid to transfer a liability in an orderly
transaction between market participants at the measurement date; and assumes that the transaction will take place either:
in the principal market; or in the absence of a principal market, in the most advantageous market.
Fair value is measured using the assumptions that market participants would use when pricing the asset or liability,
assuming they act in their economic best interests. For non-financial assets, the fair value measurement is based on its
highest and best use. Valuation techniques that are appropriate in the circumstances and for which sufficient data are
available to measure fair value, are used, maximising the use of relevant observable inputs and minimising the use of
unobservable inputs.
Assets and liabilities measured at fair value are classified, into three levels, using a fair value hierarchy that reflects the
significance of the inputs used in making the measurements. Classifications are reviewed at each reporting date and
transfers between levels are determined based on a reassessment of the lowest level of input that is significant to the fair
value measurement.
For recurring and non-recurring fair value measurements, external valuer’s may be used when internal expertise is either not
available or when the valuation is deemed to be significant. External valuer’s are selected based on market knowledge and
reputation. Where there is a significant change in fair value of an asset or liability from one period to another, an analysis
is undertaken, which includes a verification of the major inputs applied in the latest valuation and a comparison, where
applicable, with external sources of data.
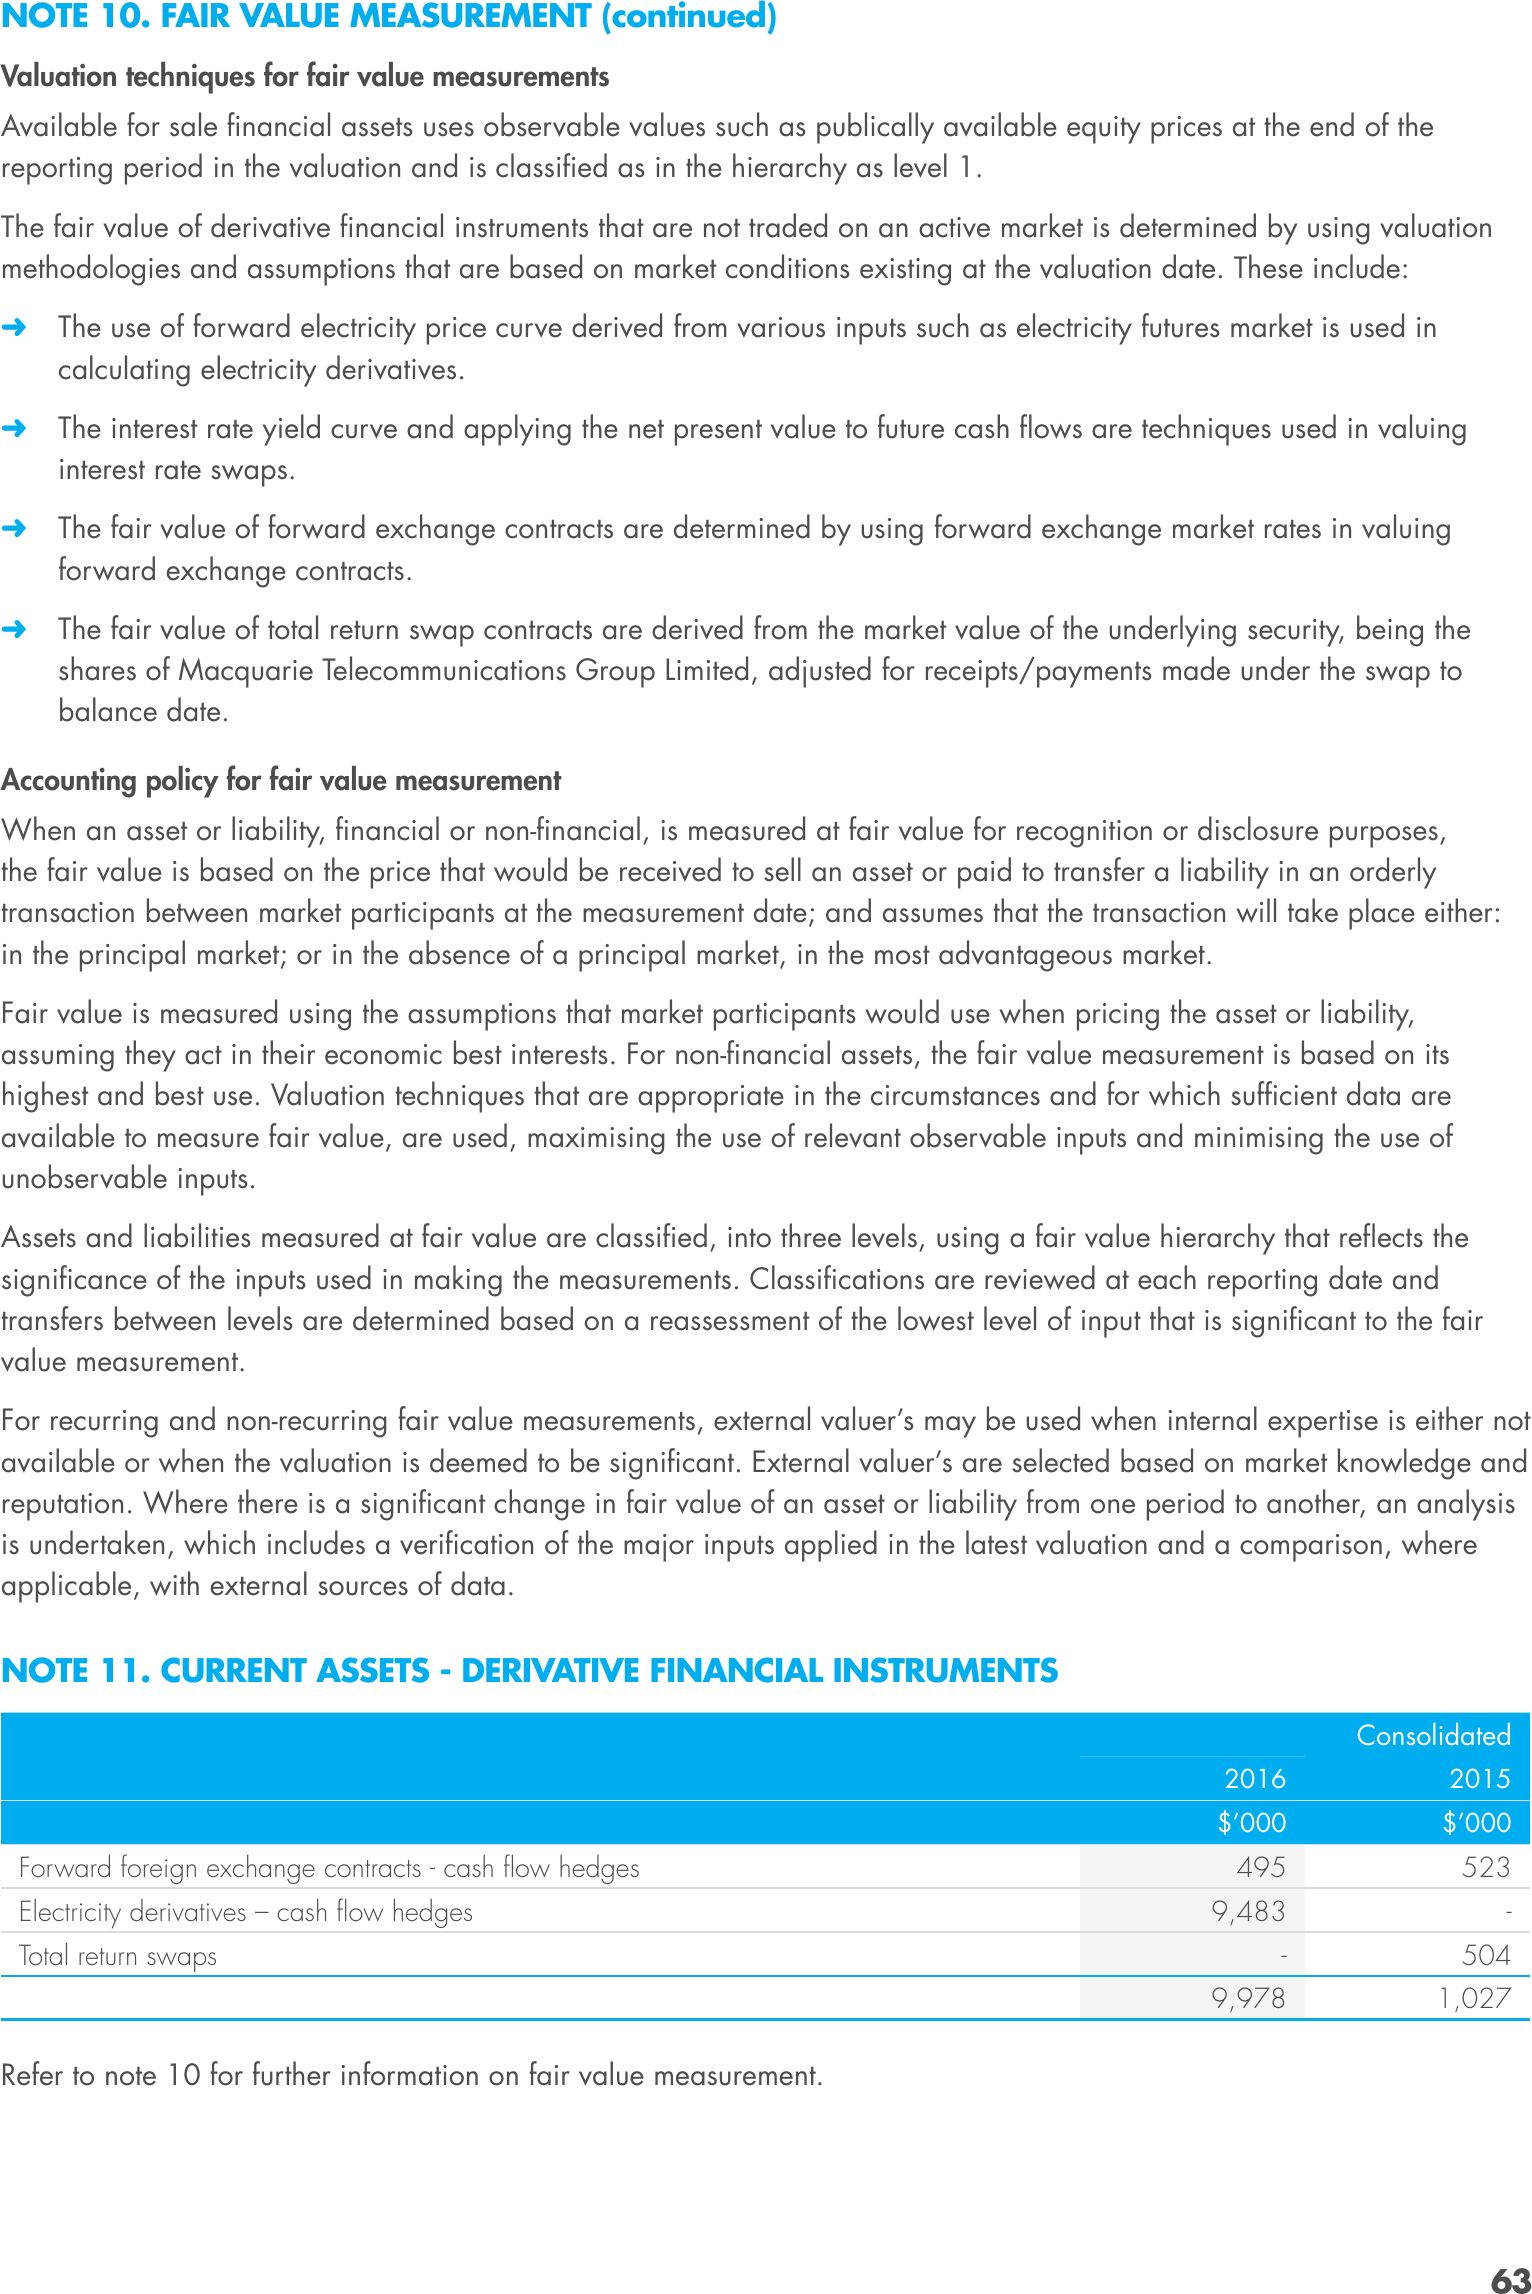
NOTE 11. CURRENT ASSETS - DERIVATIVE FINANCIAL INSTRUMENTS
Consolidated
2016
$’000
Forward foreign exchange contracts - cash flow hedges
Electricity derivatives – cash flow hedges
2015
$’000
495
523
-
-
504
9,978
Total return swaps
9,483
1,027
Refer to note 10 for further information on fair value measurement.
63
NOTES TO THE FINANCIAL STATEMENTS CONTINUED
30 JUNE 2016
NOTE 11. CURRENT ASSETS - DERIVATIVE FINANCIAL INSTRUMENTS (continued)
Forward foreign exchange contracts
Vocus have designated into forward exchange hedge relationships to buy and sell specified amounts of foreign currency
denominated in USD and Philippine Peso in the future at stipulated exchange rates. The objective of entering the forward
exchange contracts is to protect Vocus against unfavourable exchange rate movements for high probable forecasted
purchase of inventory and payments for services.
The forward exchange contracts mature within the next financial year and have been designated based on forecasted
foreign currency denominated purchases. Gains or losses recognised in the cash flow hedge reserve in equity on forward
foreign exchange contracts as of 30 June 2016 will be released to the income statement when the underlying anticipated
transactions affect the income statement or included in the carrying value of asset or liabilities acquired.
Interest rate swaps
Vocus currently holds interest swap agreements to protect the syndicated loan facility from exposure to increasing interest
rates. A hedge relationship was designated on this date. Under these interest rate swap agreements, the Group pays a
fixed rate of interest between 2.16% and 2.80% per annum, and receives interest at a variable rate.
The contracts require settlement of net interest receivable or payable each 90 days. The next settlement is on
21 September 2016.
The gain or loss from remeasuring the hedging instruments at fair value is recognised in other comprehensive income and
deferred in equity in the cash flow hedge reserve, to the extent that the hedge is effective. It is reclassified into profit or loss
when the hedged interest expense is recognised.
Electricity derivatives
Vocus manages this exposure of floating purchase price of electricity through purchase of electricity futures contracts
from the Australian Energy Market Operator (AEMO). The hedged anticipated electricity purchase and sale transactions
are expected to occur for each half hour period throughout the next quarter from the reporting date consistent with the
forecast demand from customers over this period. Gains or losses recognised in the cash flow hedge reserve in equity on
the forward foreign exchange contracts as of 30 June 2016 will be released to the income statement when the underlying
anticipated purchase or sale transactions are recognised in the income statement.
Accounting policy for derivative financial instruments
Derivatives are initially recognised at fair value on the date a derivative contract is entered into and are subsequently
remeasured to their fair value at each reporting date. The accounting for subsequent changes in fair value depends on
whether the derivative is designated as a hedging instrument, and if so, the nature of the item being hedged.
Derivatives are classified as current or non-current depending on the expected period of realisation.
Cash flow hedges
Cash flow hedges are used to cover exposure to variability in cash flows that is attributable to particular risks associated
with a recognised asset or liability or a firm commitment which could affect profit or loss. The effective portion of the gain
or loss on the hedging instrument is recognised directly in equity, whilst the ineffective portion is recognised in profit or loss.
Amounts taken to equity are transferred out of equity and included in the measurement of the hedged transaction when the
forecast transaction occurs.
Cash flow hedges are tested for effectiveness on a regular basis both retrospectively and prospectively to ensure that each
hedge is highly effective and continues to be designated as a cash flow hedge. If the forecast transaction is no longer
expected to occur, the amounts recognised in equity are transferred to profit or loss.
If the hedging instrument is sold, terminated, expires, exercised without replacement or rollover, or if the hedge becomes
ineffective and is no longer a designated hedge, the amounts previously recognised in equity remain in equity until the
forecast transaction occurs.
64 | VOCUS.COM.AU