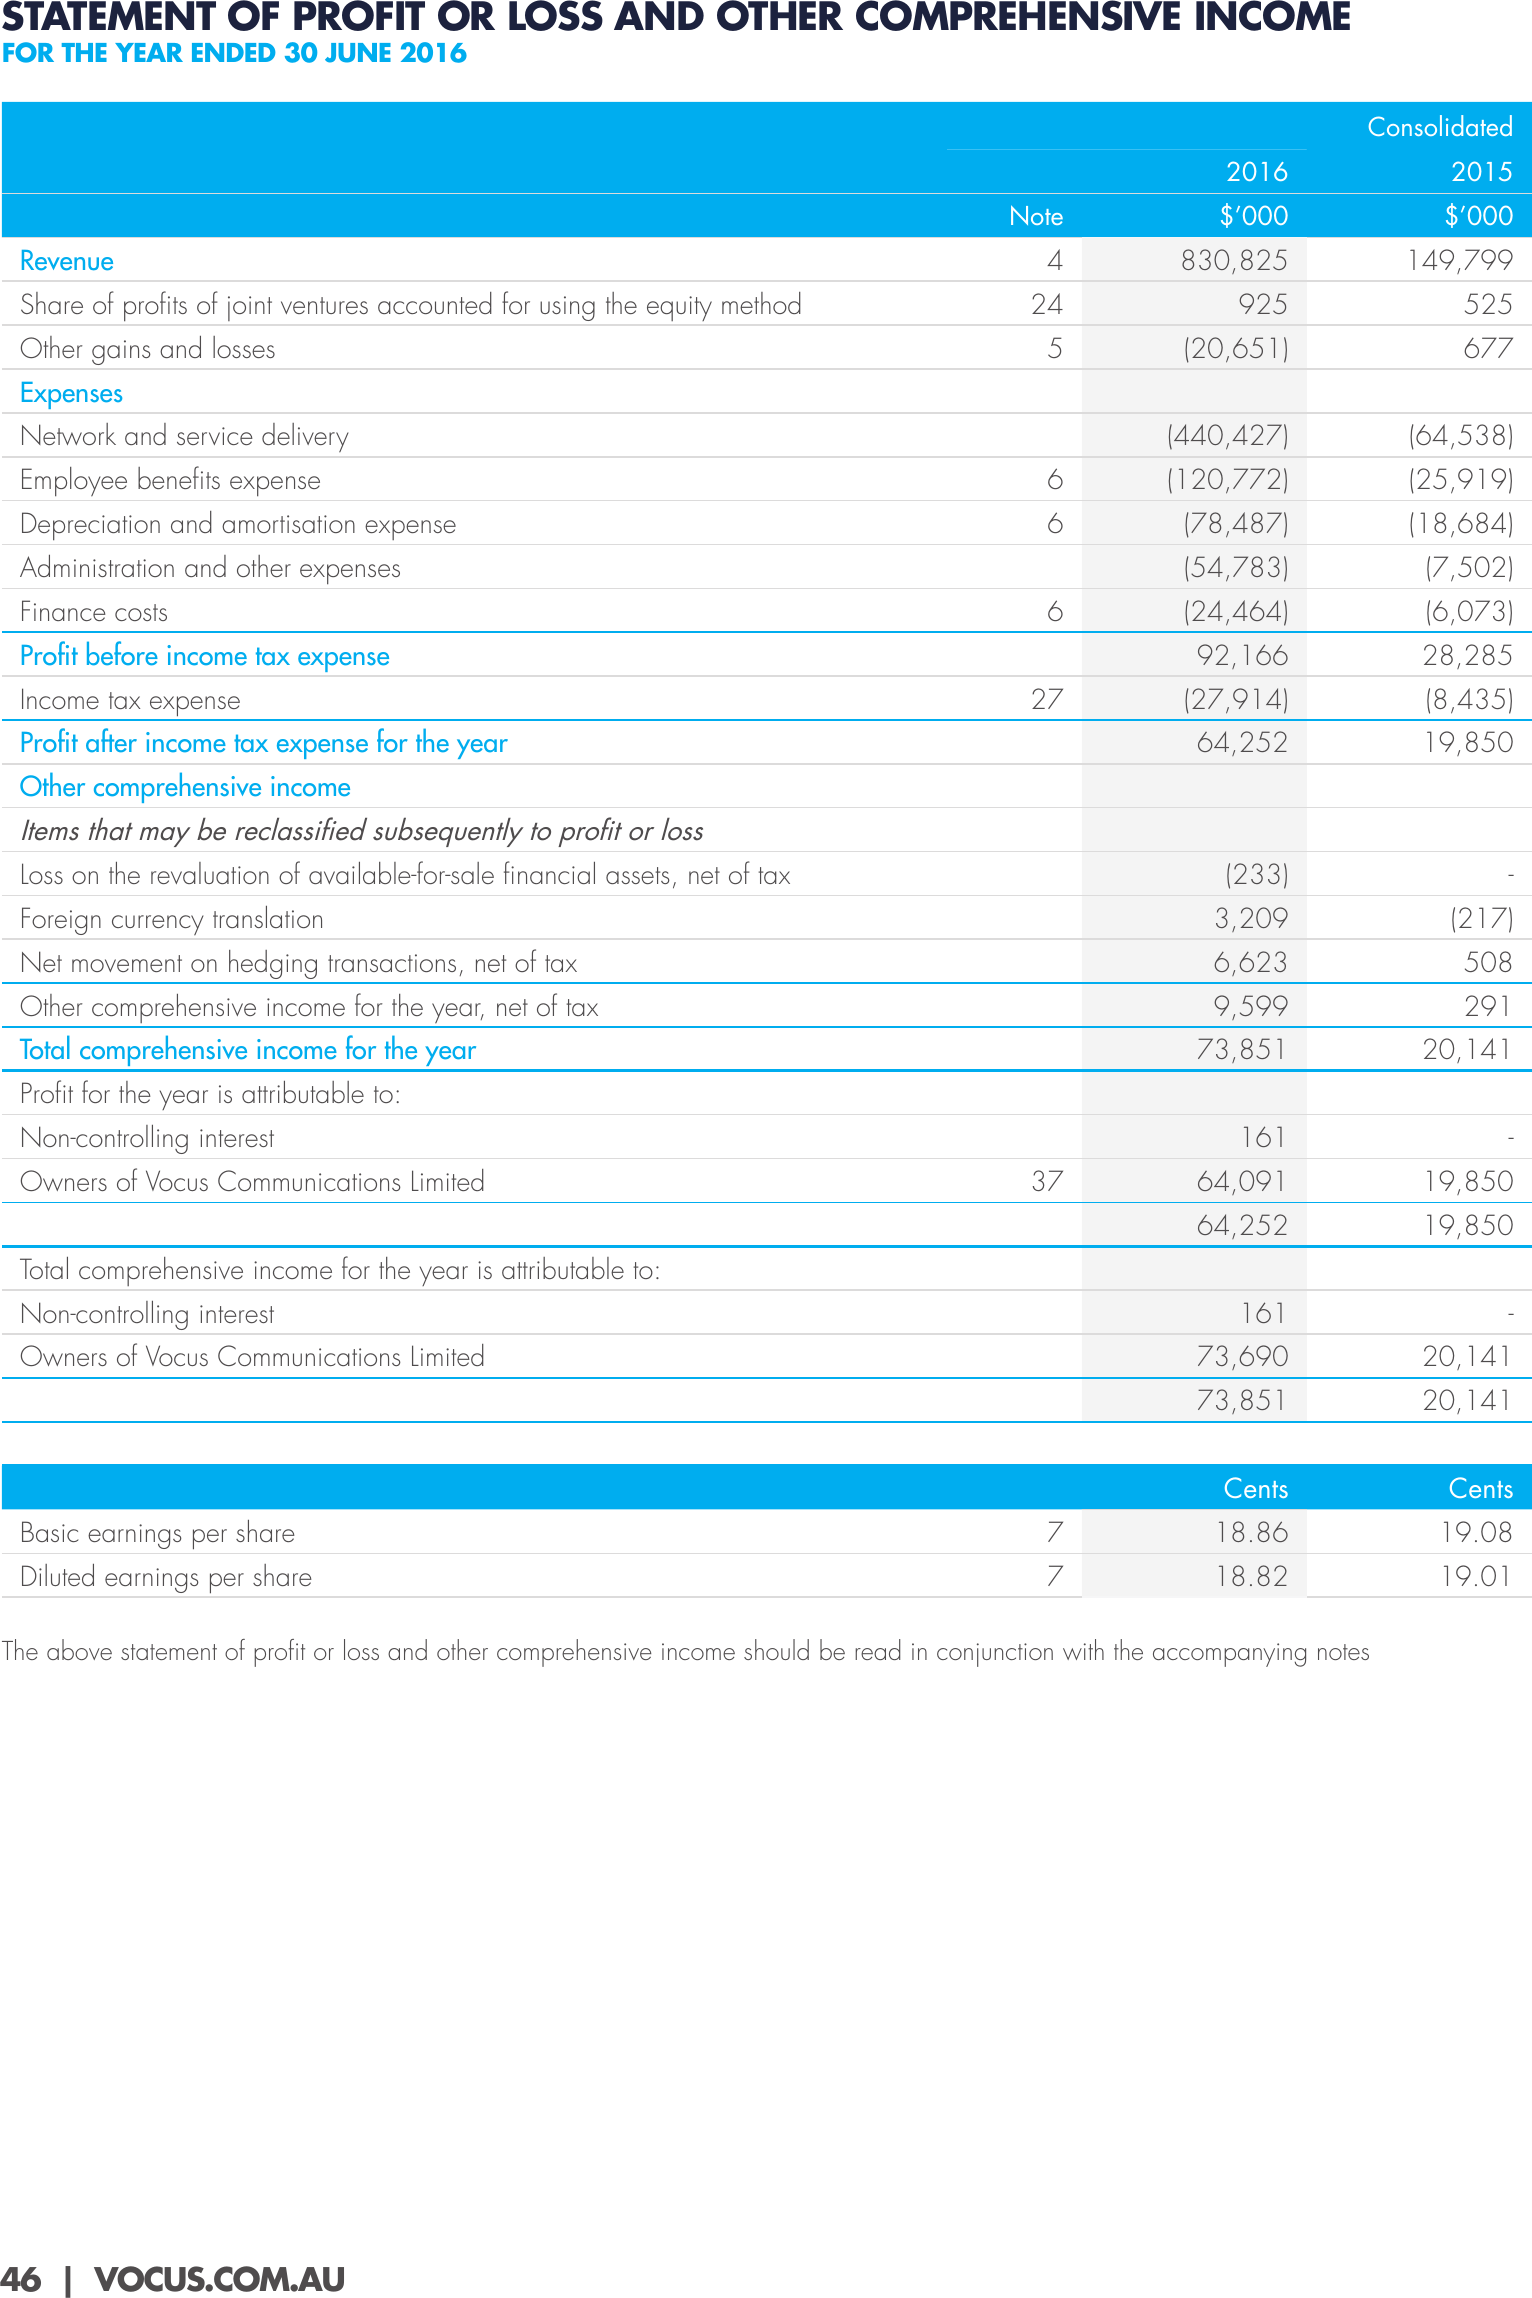
STATEMENT OF PROFIT OR LOSS AND OTHER COMPREHENSIVE INCOME
FOR THE YEAR ENDED 30 JUNE 2016
Consolidated
2016
2015
Note
Revenue
Share of profits of joint ventures accounted for using the equity method
Other gains and losses
$’000
$’000
4
830,825
149,799
24
925
525
5
(20,651)
677
Expenses
Network and service delivery
(440,427)
(64,538)
Employee benefits expense
6
(120,772)
(25,919)
Depreciation and amortisation expense
6
(78,487)
(18,684)
(54,783)
(7,502)
Administration and other expenses
Finance costs
6
Income tax expense
27
(24,464)
(6,073)
92,166
Profit before income tax expense
28,285
(27,914)
(8,435)
64,252
19,850
(233)
-
Foreign currency translation
3,209
(217)
Net movement on hedging transactions, net of tax
6,623
508
Profit after income tax expense for the year
Other comprehensive income
Items that may be reclassified subsequently to profit or loss
Loss on the revaluation of available-for-sale financial assets, net of tax
Other comprehensive income for the year, net of tax
9,599
291
73,851
20,141
161
-
64,091
19,850
64,252
Total comprehensive income for the year
19,850
Profit for the year is attributable to:
Non-controlling interest
Owners of Vocus Communications Limited
37
Total comprehensive income for the year is attributable to:
Non-controlling interest
161
-
73,690
20,141
73,851
Owners of Vocus Communications Limited
20,141
Cents
Cents
Basic earnings per share
7
18.86
19.08
Diluted earnings per share
7
18.82
19.01
The above statement of profit or loss and other comprehensive income should be read in conjunction with the accompanying notes
46 | VOCUS.COM.AU
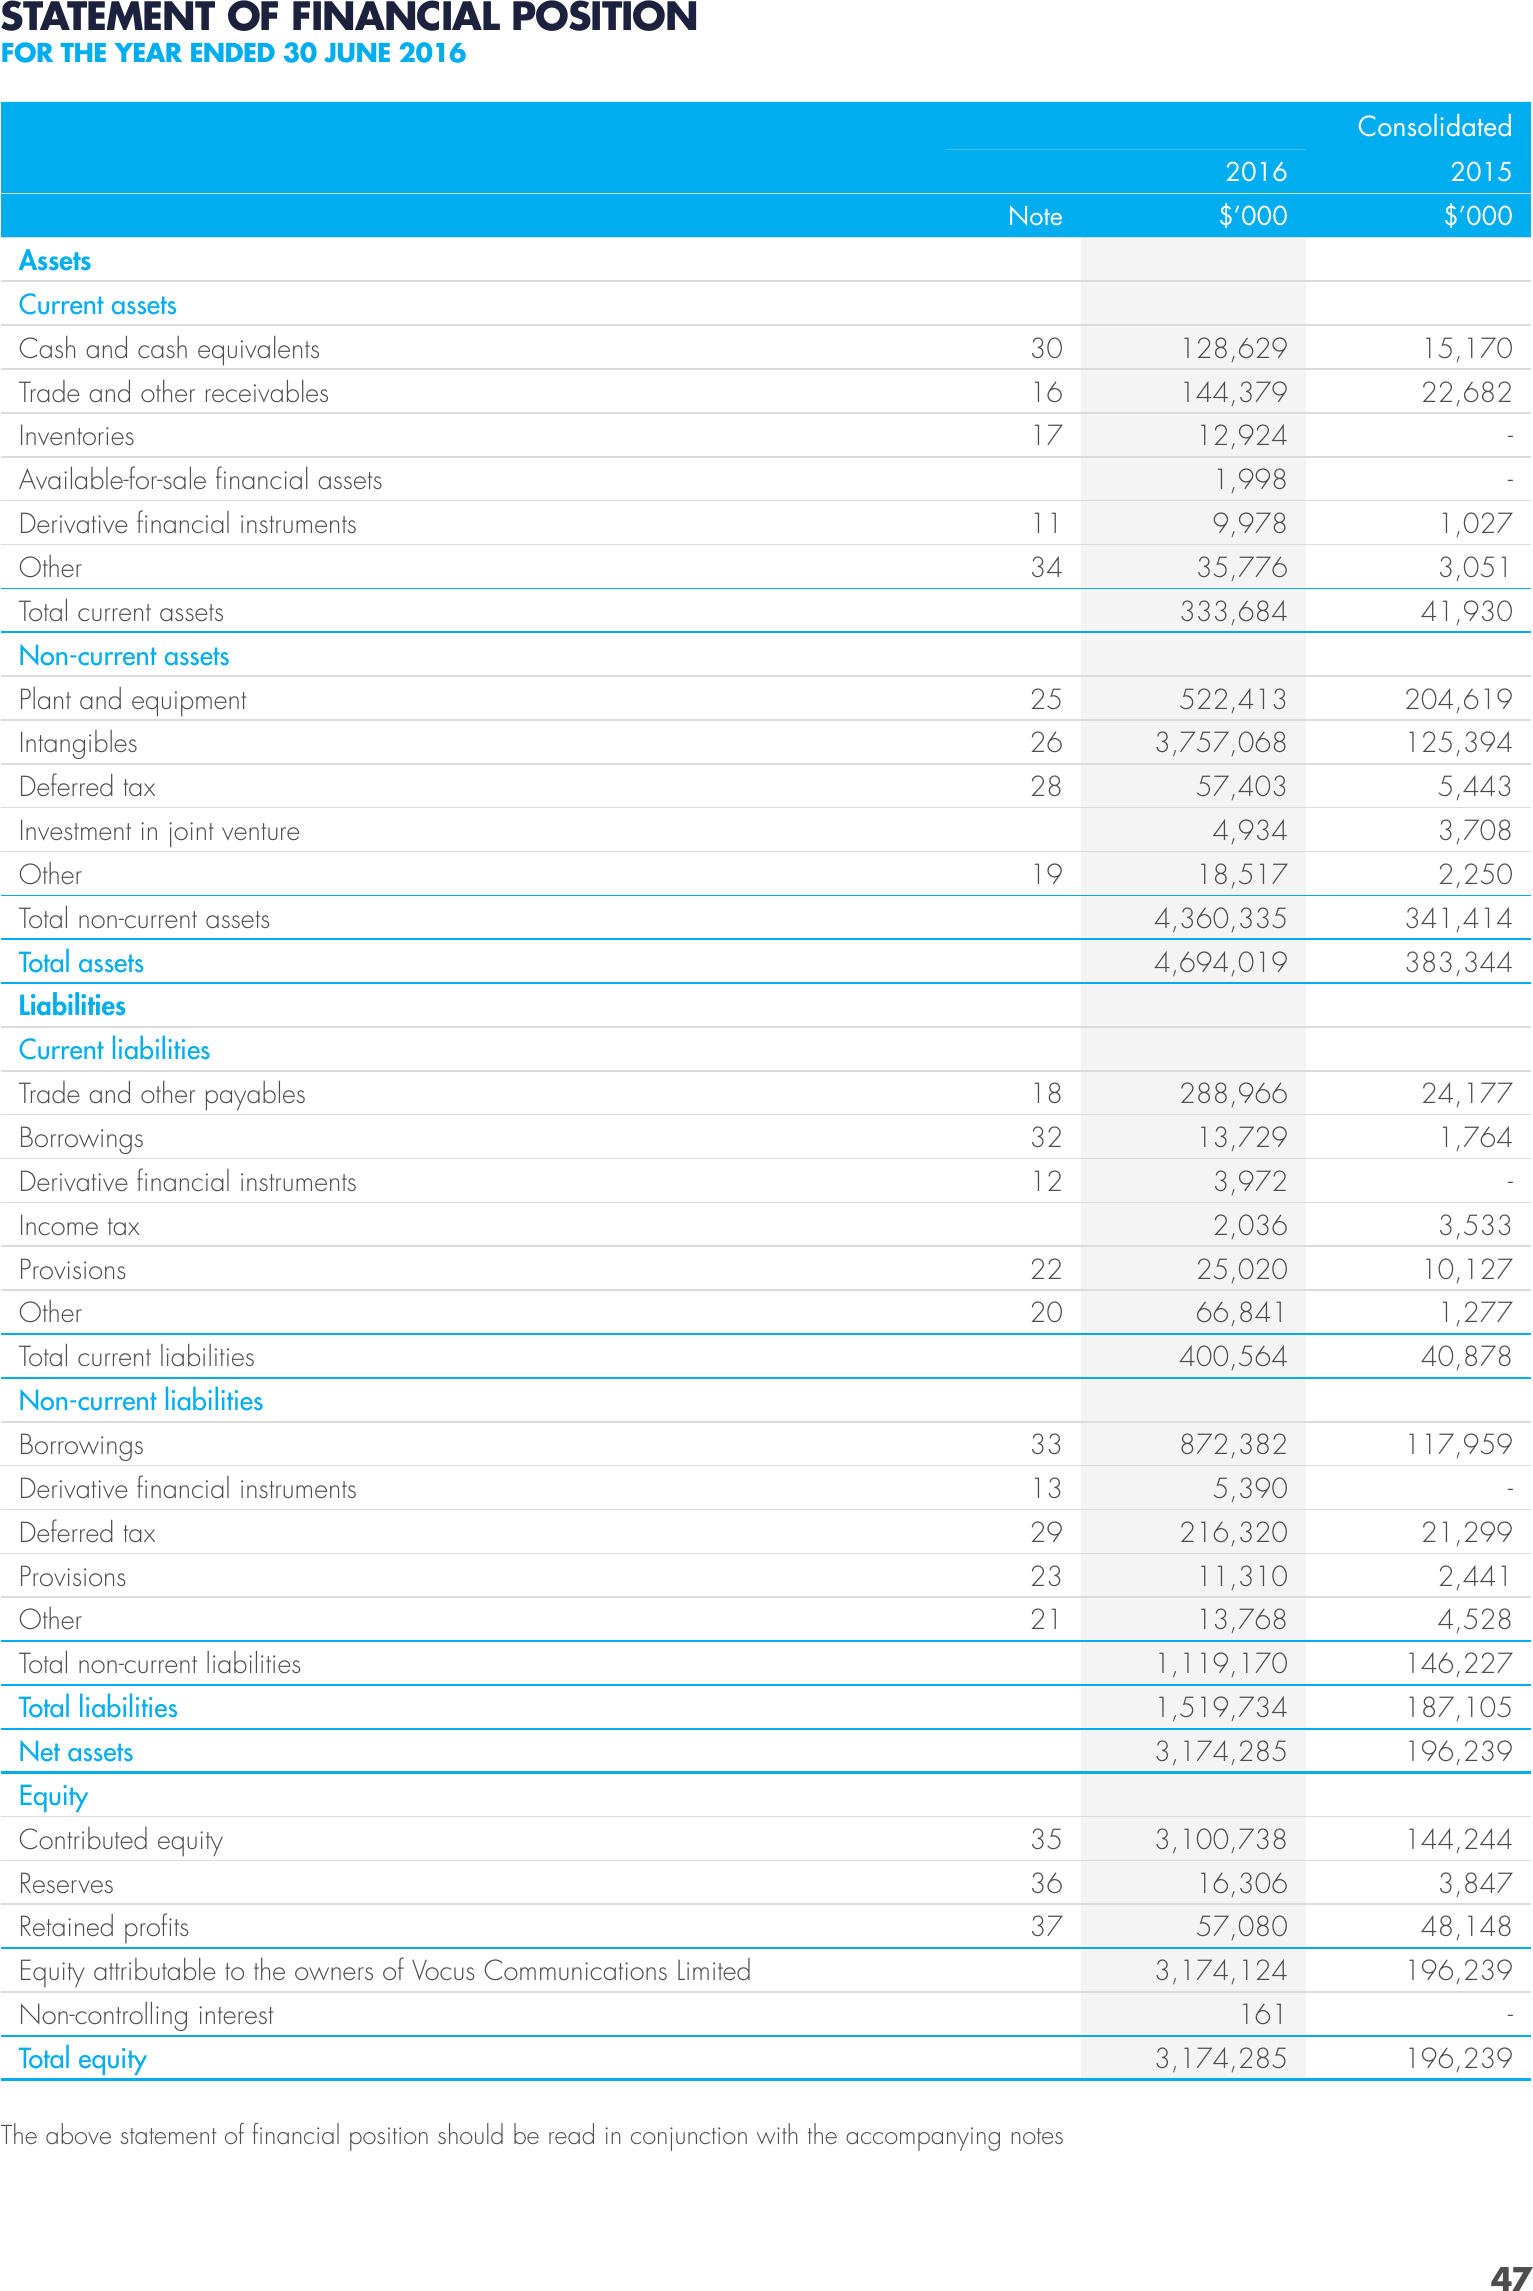
STATEMENT OF FINANCIAL POSITION
FOR THE YEAR ENDED 30 JUNE 2016
Consolidated
2016
2015
Note
$’000
$’000
Cash and cash equivalents
30
128,629
15,170
Trade and other receivables
16
144,379
22,682
Inventories
17
12,924
-
1,998
-
Assets
Current assets
Available-for-sale financial assets
Derivative financial instruments
11
9,978
1,027
Other
34
35,776
3,051
333,684
41,930
Total current assets
Non-current assets
Plant and equipment
25
522,413
204,619
Intangibles
26
3,757,068
125,394
Deferred tax
28
57,403
5,443
4,934
3,708
18,517
2,250
Total non-current assets
4,360,335
341,414
Total assets
4,694,019
383,344
Investment in joint venture
Other
19
Liabilities
Current liabilities
Trade and other payables
18
288,966
24,177
Borrowings
32
13,729
1,764
Derivative financial instruments
12
3,972
-
2,036
3,533
10,127
Income tax
Provisions
22
25,020
Other
20
66,841
1,277
400,564
40,878
872,382
117,959
Total current liabilities
Non-current liabilities
Borrowings
33
Derivative financial instruments
13
5,390
-
Deferred tax
29
216,320
21,299
Provisions
23
11,310
2,441
Other
21
13,768
4,528
Total non-current liabilities
1,119,170
146,227
Total liabilities
1,519,734
187,105
Net assets
3,174,285
196,239
144,244
Equity
Contributed equity
35
3,100,738
Reserves
36
16,306
3,847
Retained profits
37
57,080
48,148
3,174,124
196,239
161
-
3,174,285
196,239
Equity attributable to the owners of Vocus Communications Limited
Non-controlling interest
Total equity
The above statement of financial position should be read in conjunction with the accompanying notes
47
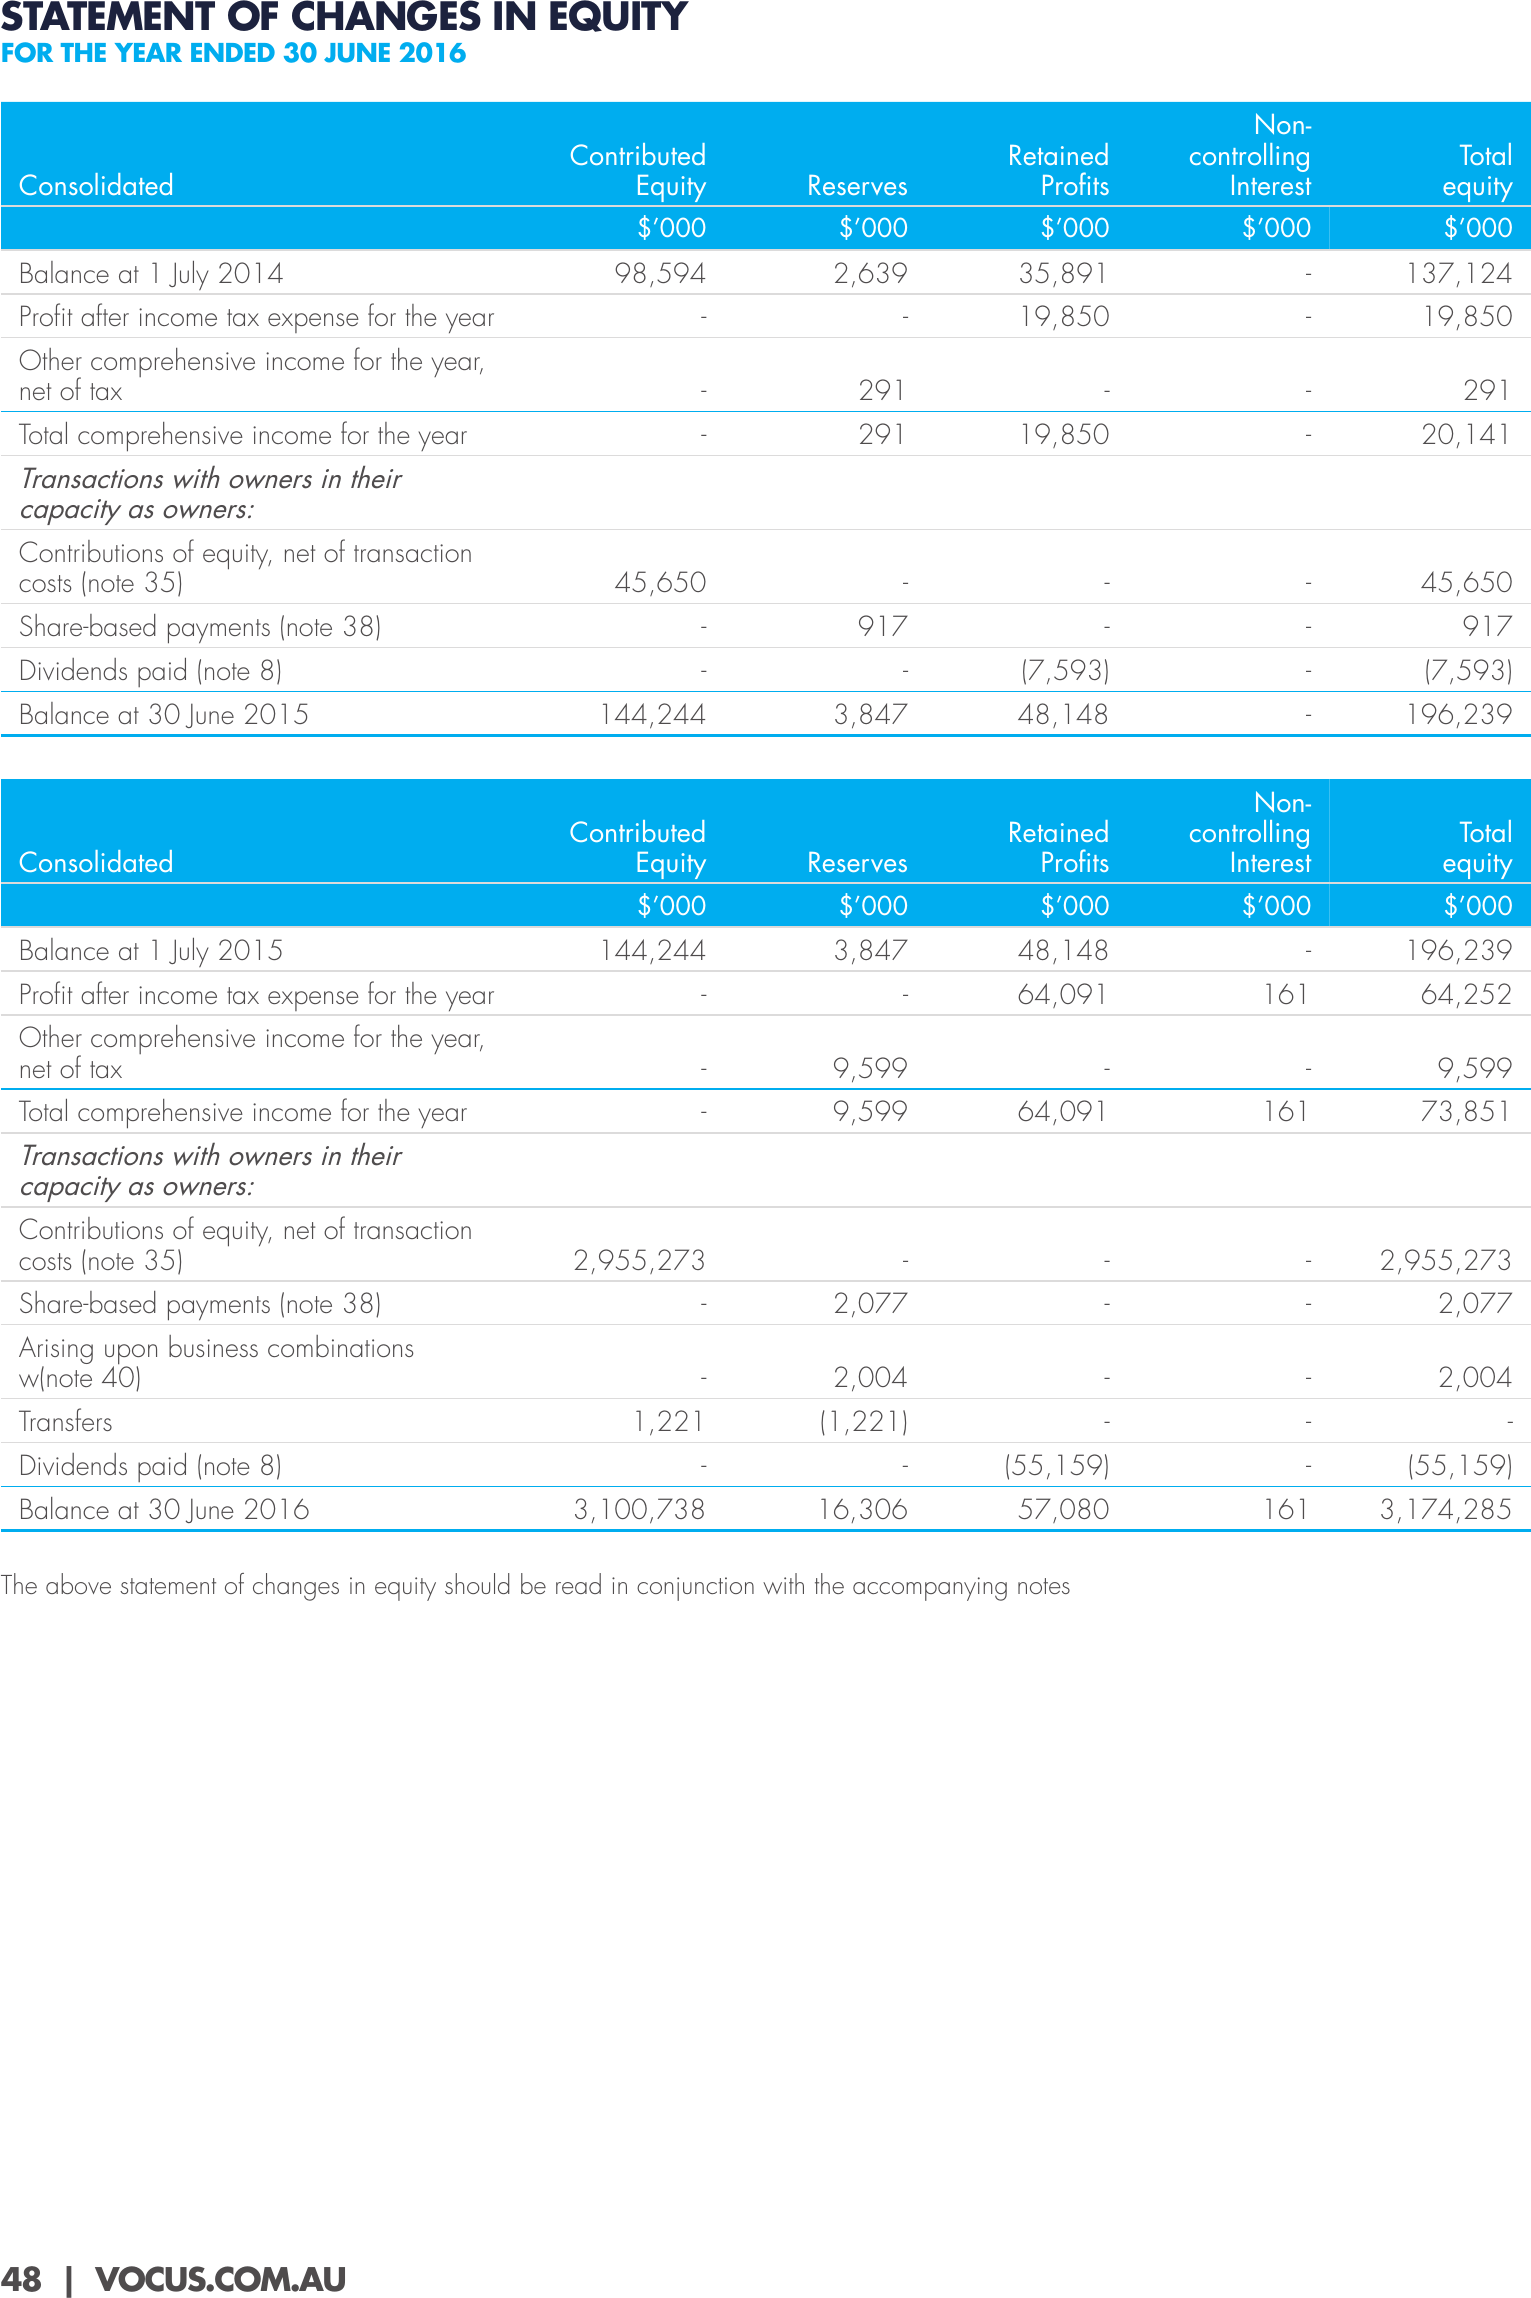
STATEMENT OF CHANGES IN EQUITY
FOR THE YEAR ENDED 30 JUNE 2016
Consolidated
Contributed
Equity
Reserves
Retained
Profits
Noncontrolling
Interest
Total
equity
$’000
Balance at 1 July 2014
$’000
$’000
$’000
$’000
98,594
2,639
35,891
-
137,124
Profit after income tax expense for the year
-
-
19,850
-
19,850
Other comprehensive income for the year,
net of tax
-
291
-
-
291
Total comprehensive income for the year
-
291
19,850
-
20,141
45,650
Transactions with owners in their
capacity as owners:
Contributions of equity, net of transaction
costs (note 35)
45,650
-
-
-
Share-based payments (note 38)
-
917
-
-
917
Dividends paid (note 8)
-
-
(7,593)
-
(7,593)
144,244
3,847
48,148
-
196,239
Reserves
Retained
Profits
Noncontrolling
Interest
Total
equity
Balance at 30 June 2015
Consolidated
Contributed
Equity
$’000
Balance at 1 July 2015
Profit after income tax expense for the year
$’000
$’000
$’000
$’000
144,244
3,847
48,148
-
196,239
-
-
64,091
161
64,252
Other comprehensive income for the year,
net of tax
-
9,599
-
-
9,599
Total comprehensive income for the year
-
9,599
64,091
161
73,851
Transactions with owners in their
capacity as owners:
Contributions of equity, net of transaction
costs (note 35)
2,955,273
-
-
-
2,955,273
Share-based payments (note 38)
-
2,077
-
-
2,077
Arising upon business combinations
w(note 40)
-
2,004
-
-
2,004
1,221
(1,221)
-
-
-
-
-
(55,159)
-
(55,159)
3,100,738
16,306
57,080
161
3,174,285
Transfers
Dividends paid (note 8)
Balance at 30 June 2016
The above statement of changes in equity should be read in conjunction with the accompanying notes
48 | VOCUS.COM.AU
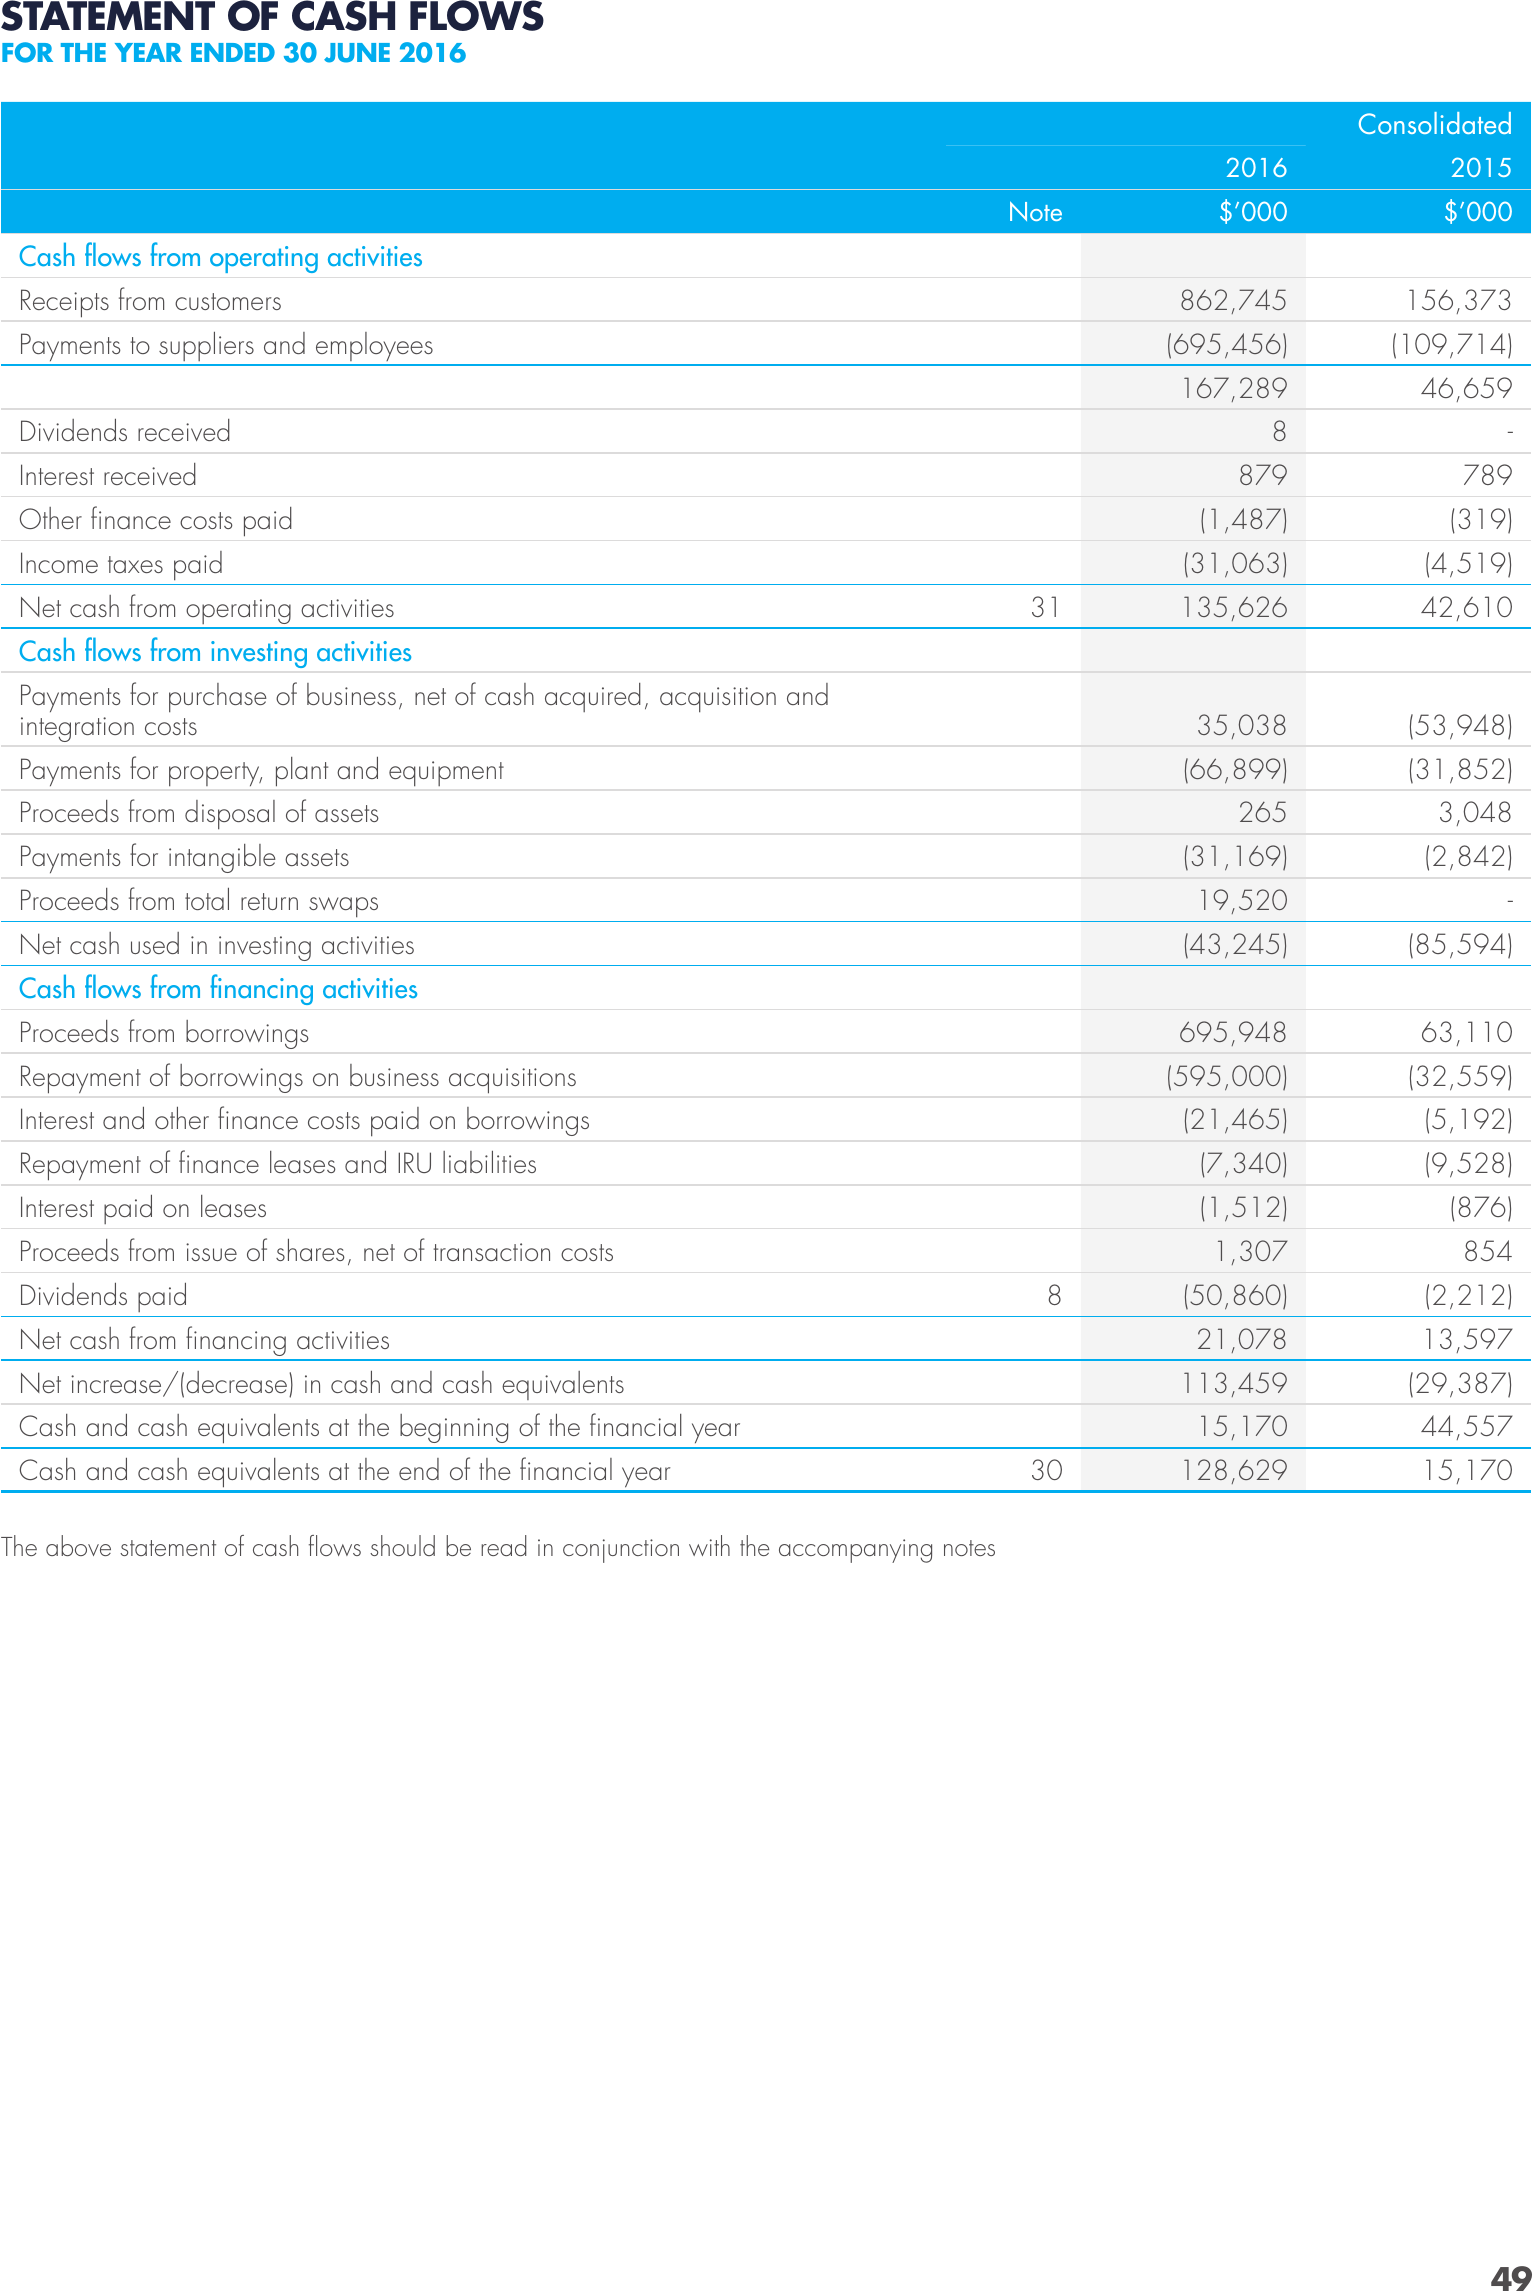
STATEMENT OF CASH FLOWS
FOR THE YEAR ENDED 30 JUNE 2016
Consolidated
2016
2015
$’000
$’000
862,745
156,373
(695,456)
(109,714)
167,289
Note
46,659
Cash flows from operating activities
Receipts from customers
Payments to suppliers and employees
Dividends received
8
Other finance costs paid
789
(1,487)
(4,519)
135,626
42,610
35,038
(53,948)
(66,899)
31
(319)
(31,063)
Income taxes paid
Net cash from operating activities
-
879
Interest received
(31,852)
Cash flows from investing activities
Payments for purchase of business, net of cash acquired, acquisition and
integration costs
Payments for property, plant and equipment
Proceeds from disposal of assets
265
Proceeds from total return swaps
3,048
(31,169)
Payments for intangible assets
(2,842)
19,520
-
(43,245)
Net cash used in investing activities
(85,594)
Cash flows from financing activities
Proceeds from borrowings
695,948
Interest and other finance costs paid on borrowings
63,110
(595,000)
Repayment of borrowings on business acquisitions
(32,559)
(21,465)
(5,192)
Repayment of finance leases and IRU liabilities
(7,340)
(9,528)
Interest paid on leases
(1,512)
(876)
1,307
854
Proceeds from issue of shares, net of transaction costs
Dividends paid
8
Cash and cash equivalents at the end of the financial year
30
(29,387)
15,170
Cash and cash equivalents at the beginning of the financial year
(2,212)
13,597
113,459
Net increase/(decrease) in cash and cash equivalents
(50,860)
21,078
Net cash from financing activities
44,557
128,629
15,170
The above statement of cash flows should be read in conjunction with the accompanying notes
49